
Project Overview
Transforming a Client’s Draft into a Structured, Data-Driven Capstone Paper
A client approached Excellence Innovations seeking professional academic guidance and review support for an Applied Business Economics capstone paper. The client already had an existing draft and wanted assistance in strengthening its structure, analysis, presentation, and overall academic quality while preserving the original research direction, introduction, problem statement, objectives, and key case-specific information.
Our role was therefore focused on reviewing the draft, identifying areas for improvement, and providing targeted recommendations so that the client could refine the work without changing its core academic purpose.
The paper focused on:
“The Case of Axelum Resources Corporation: Low-Cost, High-Return Strategy for Entering the High-Margin Coconut Products Market in Spain.”

🎧 24×7 Support
Client Initial Requirement
The project began with a direct consultation in which the client confirmed that the assignment required support from someone with an economics background. That requirement was important because the capstone paper combined applied economics, business strategy, financial performance, and industry analysis rather than relying on a single academic discipline.
The initial communication also established the working process: the client would share the existing material, and the paper would then be reviewed and improved around the assignment’s economics-focused requirements.


Starting Point: An Existing 34-Page Draft
The client provided an approximately 34-page Applied Business Economics Capstone Paper Draft and requested focused academic guidance to strengthen the existing work. The objective was not to replace the client’s ideas or develop a new paper, but to review, refine, and support improvement of the original draft while preserving the intended introduction, problem statement, objectives, and overall case direction.
Our support focused on identifying areas where the client could improve the structure, presentation, analytical depth, and integration of supporting evidence. Through targeted review, feedback, and academic guidance, we helped the client strengthen the organisation and clarity of the paper while ensuring that the underlying ideas and academic direction remained their own.
Required Academic Framework
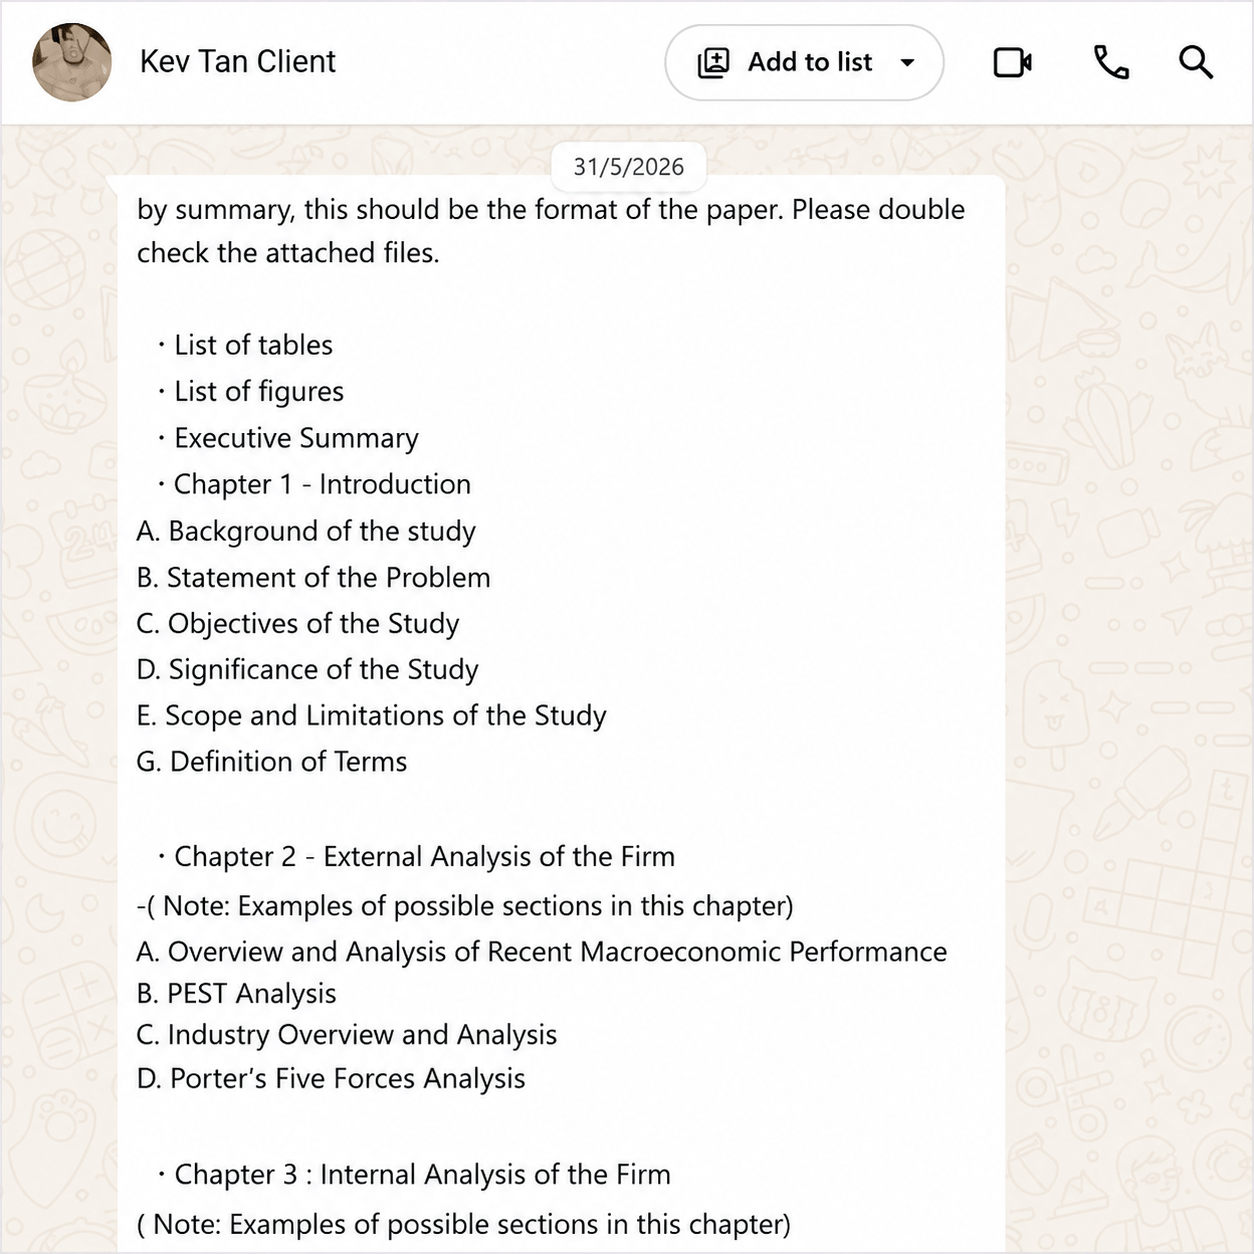
The client also shared a clearly defined academic structure that the paper was expected to follow. Our role was to review the existing draft against this prescribed framework and guide the client on how each section could be strengthened, rather than introducing a different structure.
The required format included front matter such as the List of Tables, List of Figures, and Executive Summary, followed by three main chapters:
Chapter 1 – Introduction: background of the study, statement of the problem, objectives, significance, scope and limitations, and definition of terms.
Chapter 2 – External Analysis of the Firm: recent macroeconomic performance, PEST analysis, industry overview and analysis, and Porter’s Five Forces analysis.
Chapter 3 – Internal Analysis of the Firm: internal business and financial evaluation, including efficiency-related analysis.
Our review therefore focused on helping the client maintain clear links between macroeconomic conditions, industry-level forces, and company-level financial performance. Feedback and recommendations were provided within the client’s required academic framework so that the structure, analysis, and presentation could be refined without changing the intended direction of the paper.
Our Academic Support Approach
Review and Reorganisation
External Business and Economic Analysis
Internal and Financial Analysis
Presentation of Evidence

Financial Ratio Analysis: Strengthening the Quantitative Evidence
A key part of our support involved reviewing the client’s financial ratio analysis for 2019–2023 and guiding the presentation of the quantitative evidence. The appendix contained major indicators including the Current Ratio, Debt-to-Equity Ratio, Debt Ratio, Return on Assets, Return on Equity, Gross Profit Margin, EBITDA Margin, Operating Margin, Net Profit Margin, and Asset Turnover.
Our review focused on helping the client interpret the ratios as a connected picture of liquidity, leverage, profitability, and efficiency rather than presenting the figures in isolation. For example, the Current Ratio increased from 2.97 in 2019 to 5.88 in 2021, before declining to 4.69 in 2022 and 3.90 in 2023. The Debt-to-Equity Ratio remained relatively low, decreasing from 0.23 in 2019 to 0.13 in 2023.
We also highlighted the need to discuss the deterioration in profitability shown in the supplied 2023 ratios, including ROA (-7.3%), ROE (-8.2%), EBITDA Margin (-12%), Operating Margin (-3%), and Net Profit Margin (-14.4%). This guidance helped the client strengthen the financial discussion by linking the numerical results with broader company performance and the surrounding economic and industry context.
Efficiency Analysis: Guiding Ratio Interpretation
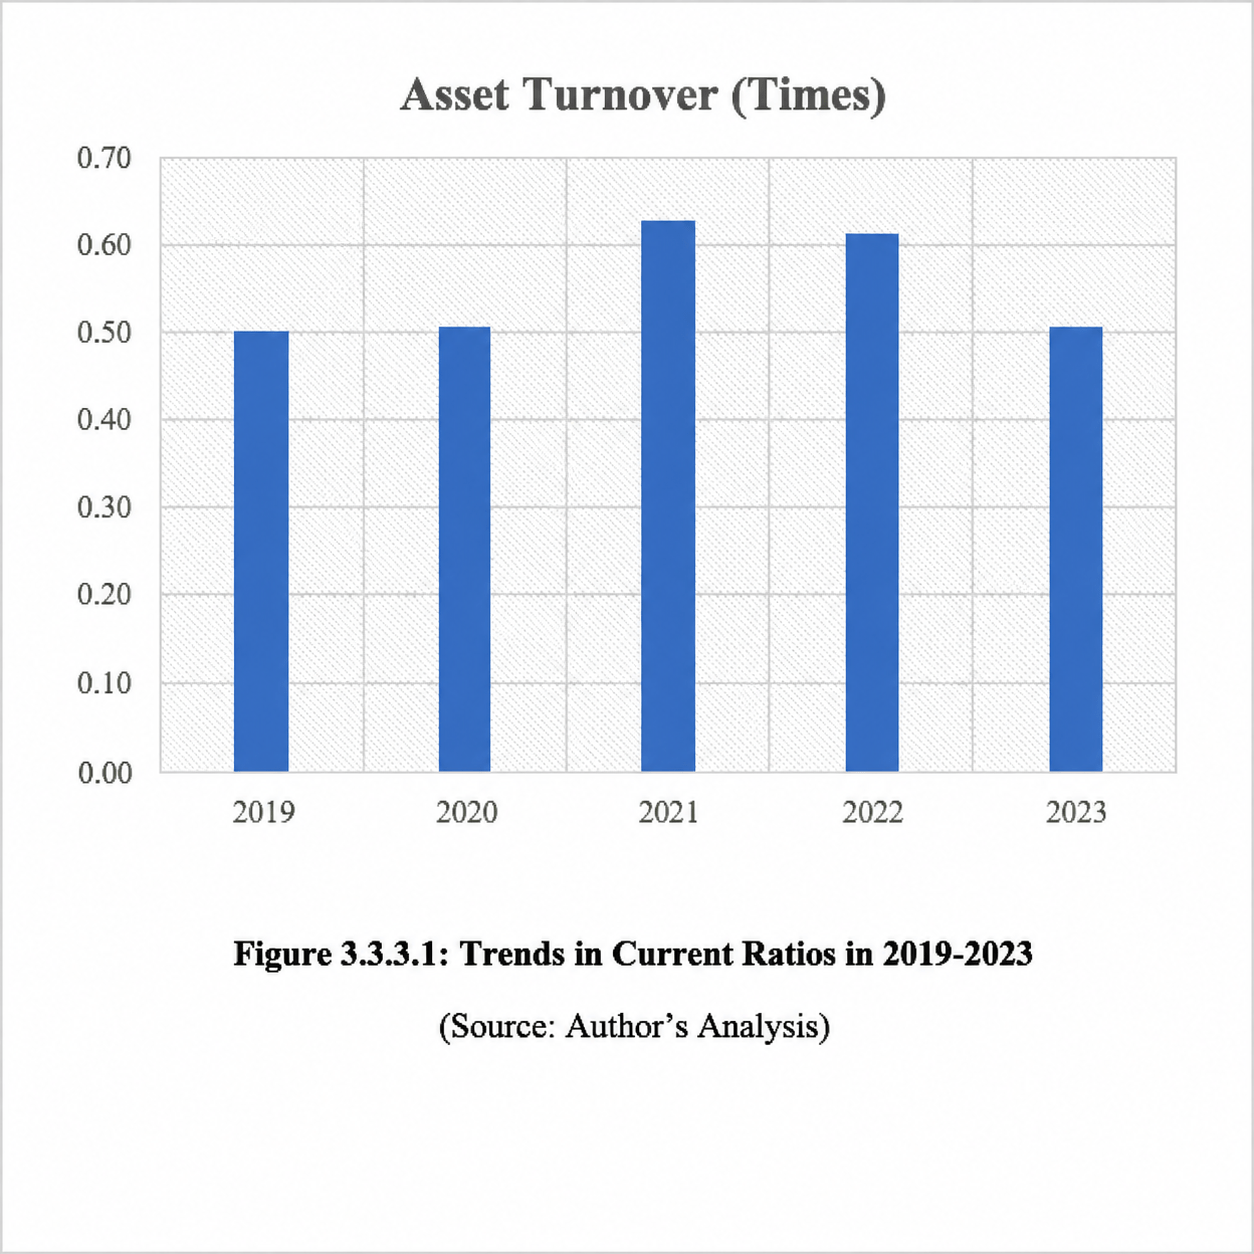
Our review also focused on helping the client move beyond simply reporting financial ratios and develop a clearer interpretation of operational efficiency. Particular attention was given to Asset Turnover as an indicator of how effectively the organisation used its asset base to generate revenue. The supplied figures were 0.50 times in 2019, 0.51 in 2020, 0.63 in 2021, 0.62 in 2022, and 0.51 in 2023.
We guided the client in highlighting the improvement up to 2021, the relatively stable position in 2022, and the subsequent decline in 2023. Feedback also encouraged the client to relate this decline to changes in sales revenue rather than simply assuming a reduction in the asset base, supporting a more meaningful discussion of weaker asset-utilisation efficiency.
We also recommended presenting the ratio trend visually alongside the discussion. This helped the client combine quantitative evidence with narrative interpretation, making the efficiency analysis clearer and easier for readers to understand.
Outcome: Strengthening the Existing Capstone Through Guided Review
The support process helped the client refine a substantial existing draft into a more coherent Applied Business Economics case analysis while preserving the central ideas and direction of the original paper. Our guidance focused on strengthening the links between macroeconomic conditions, industry analysis, and internal financial evidence so that the client could present the company’s strategic position using both qualitative and quantitative material.
We also guided the client in improving the presentation of financial analysis by organising it in clear stages: ratio evidence, focused interpretation, and visual trend presentation. This made the quantitative sections easier to follow and gave the financial discussion a stronger analytical purpose. The final improvements remained client-led, with our role centred on review, feedback, and academic support.
CONTACT US
Client Feedback
After the work was organised and delivered, the client expressed appreciation for the patience, service, and coordination provided during the project. The feedback serves as the closing evidence in the case-study journey: from the initial request for economics expertise, through draft review and analysis, to completed support and client acknowledgement.