Case Study: Assignment Writing with Tableau Data Visualization
Client Name: Avisekh Mitra
Institution: Berlin School of Business and Innovation (BSBI), Berlin.
Project: HR Analytics Dashboard.
Core Support: Content Review and Refinement, HR Data Analysis Guidance, Tableau Dashboard Development Support, Data Visualization Review, and Presentation Improvement.
Software Used: Tableau
Project Area: HR Analytics and Data Visualization
Final Result: 77%
Support Approach: The project remained client-led throughout
while Excellence Innovations provided academic and technical guidance, review, feedback, and visualization support to help the client strengthen the analysis and presentation of the HR Analytics Dashboard.

The Client’s Journey
Every successful academic support process begins with understanding the client’s existing work, assessment expectations, and the areas where focused guidance can add value.
Avisekh Mitra approached Excellence Innovations for academic and technical support with a project involving HR analytics, data visualization, and written interpretation as part of his studies at the Berlin School of Business and Innovation (BSBI), Berlin.
The client already had the assignment requirements and submission expectations. However, the task required more than a conventional written report. It involved analysing HR data, identifying meaningful patterns, presenting those insights through an interactive Tableau dashboard, and explaining the findings clearly in academic form.
Our role was to review the client’s approach, provide guidance on data interpretation and visualization, support the refinement of the Tableau dashboard, and offer feedback on the written analysis and presentation. The project remained client-led throughout, with Excellence Innovations supporting the client in strengthening both the analytical and visual quality of the work.
The project combined four connected requirements
Our role was therefore to review and support the integration of the technical and academic elements of the project, providing guidance at each major stage so the client could develop a coherent and well-presented final submission.
Content Review & Refinement +
Data Analysis Guidance +
Tableau Visualization Support +
Results Interpretation Guidance
Evidence Snapshot 1: The Initial Enquiry
The first conversation shows the client’s initial request for assignment support and the start of the project discussion.
Understanding the Client’s Requirements
The project began with a careful review of the assignment brief, assessment expectations, required outputs, submission timeline, and academic standards. This was important because the Tableau dashboard and written analysis needed to complement each other and present a consistent academic narrative.
The assignment required an HR Analytics Dashboard that could communicate employee-related insights clearly, while the written component needed to explain the dataset, analytical process, visualization choices, findings, and managerial implications in a logical structure.
Our role was to review the client’s planned approach and provide guidance on how the technical and academic components could be aligned effectively. We supported the client with dataset review, Tableau visualization guidance, dashboard refinement, interpretation of findings, content review, feedback, and final quality checks.
The project remained client-led throughout, with Excellence Innovations providing structured academic and technical support at each stage.
The Main Challenge
The main challenge was not simply presenting HR data through charts. The project required the client to interpret a broad range of employee variables and use them to address meaningful workforce questions that could support a clear academic discussion.
The dataset included information relating to:
• Employee demographics and age
• Job roles, departments, experience, and tenure
• Income, compensation, and overtime
• Job satisfaction and performance
• Employee attrition and retention
Our role was to review the client’s analytical approach and provide guidance on identifying relevant relationships within the data, rather than treating each variable as an isolated measure.
The analysis therefore focused on questions such as:
• Which departments and employee groups showed higher attrition?
• How did age, income, and tenure relate to employee retention?
• Was overtime associated with higher levels of attrition?
• How did job satisfaction differ between employees who stayed and those who left?
• Which workforce patterns could require greater attention from HR managers?
Through analytical review and feedback, we helped the client strengthen the connection between the Tableau visualizations, observed HR patterns, and the written interpretation, while keeping the final analysis and conclusions client-led.
Our Approach
Step 1: Reviewing the Dataset and Identifying Preparation Needs
Step 2: Guiding the Tableau Project Setup and Development
Step 3: Supporting Calculated Fields and Analytical Category Refinement
Step 4: Reviewing and Refining the HR Analytics Dashboard
Step 5: Guiding Dashboard Interactivity and User Experience
Step 6: Supporting the Translation of Tableau Analysis into Academic Content
Our support also focused on helping the client connect the Tableau analysis with the written academic component. We reviewed how the dashboard findings were being explained and provided guidance on presenting the analytical process, visualization choices, results, and managerial implications in a clear and logical structure.
The report was organised around:
• Introduction and Dataset Description
• Analytical Approach and Tableau Implementation
• Visualization Selection
• Findings and Discussion
• Business Recommendations and Conclusion
Keeping the Client Involved Throughout the Project
Client communication remained an important part of the support process. Avisekh was not simply asked to share the assignment brief and wait for a finished outcome. Instead, the project followed a client-led cycle of review, guidance, feedback, refinement, and quality checking.
At each major stage, we reviewed the client’s progress, shared recommendations, and supported revisions where needed so that the technical Tableau work and written academic discussion remained aligned.
Project Workflow:
Initial Enquiry → Requirement Discussion → Assignment Review → Dataset Review → Tableau Guidance → Dashboard Refinement → Academic Content Review → Draft Sharing → Client Feedback → Client-Led Revisions → Quality Review → Pre-Submission Support
This approach kept the client actively involved throughout and ensured that the final decisions, analysis, and submission remained under the client’s ownership.
Draft Review and Client Feedback
Once the client had developed an initial version of the report and Tableau work, we supported the review and refinement stage by examining how well the analysis, dashboard, and written discussion aligned with the assignment requirements.
The client was encouraged to review the work carefully, identify any areas requiring clarification or adjustment, and share feedback on the presentation and interpretation. We then provided further guidance on the requested changes and highlighted areas where the draft could be strengthened.
This review cycle helped the client refine the project in line with both the assessment expectations and their own academic decisions, while keeping the final revisions and submission fully client-led.
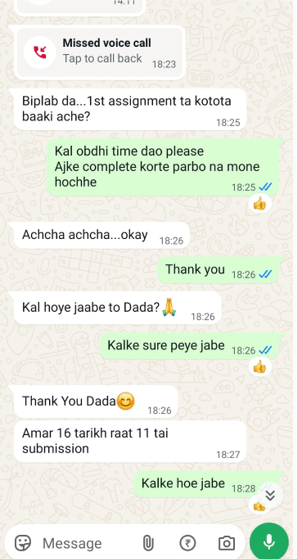
Managing the assignment Deadline
The assignment had a fixed submission deadline, so careful planning and timely academic support were essential. Our role was to help the client organise the review and refinement process into manageable stages, ensuring sufficient time was available for feedback and client-led revisions.
The support process covered dataset review, Tableau guidance, dashboard refinement, academic content review, corrections, and final quality checks. By maintaining a structured timeline, we helped the client monitor progress and address important issues before submission.
This approach ensured that the client retained enough time to review the final project, make their own academic decisions, and complete the submission confidently within the required deadline.
Final Quality Review
Before the client completed the final submission, we reviewed the technical and academic components together to help ensure that the Tableau dashboard and written discussion were consistent with each other. This was important because the report needed to explain the analytical findings accurately, while the dashboard needed to reflect the same evidence clearly.
For the academic content, our review focused on:
- Alignment with the assignment brief
- Academic structure, clarity, and quality of interpretation
- Academic language, grammar, citations, and references
- Formatting and overall presentation
- Consistency between Tableau findings and written discussion
For the Tableau dashboard, our review focused on:
- Dashboard layout and visualization selection
- Calculated fields and analytical logic
- Filters and interactivity
- Data presentation and visual clarity
- Consistency of analytical results
Following these checks, we provided final feedback so the client could make any necessary revisions before submission, with the final academic decisions and submission remaining fully client-led.
The Final Outcome: Client-Reported 77% Result
After completing the review, refinement, and final quality-checking stages, the client submitted the project in line with the university requirements. Following assessment, Avisekh contacted Excellence Innovations to share that he had achieved an overall result of 77%.
For our team, this feedback marked the completion of a client-led support journey that included requirement review, Tableau guidance, dashboard refinement, academic content review, feedback, revision support, and pre-submission quality checks.
The reported result provided a positive indication that the client’s final submission had met the expected academic standard, while the analysis, academic decisions, and submission remained fully under the client’s ownership.
Client Review
Avisekh Mitra
“Hi I am an International Student of Data Science in Berlin, Germany and I need help regarding my Data Visualization assignment… they fulfilled my expectations providing every help and support for my assignment needs. Truly professional and true to their name innovative.”
Published Client Review
A five-star review from Avishek Mitra describing his experience with Excellence Innovations and the support provided for his Data Visualization assignment.