
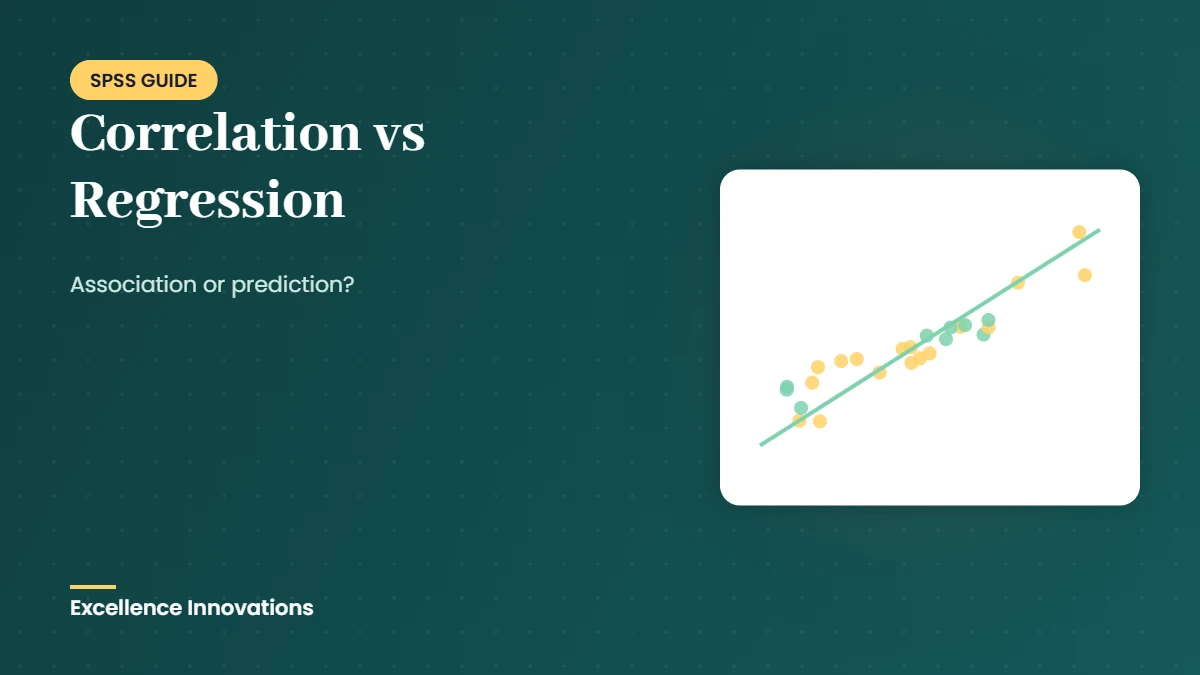
Correlation and regression are two commonly used statistical techniques for examining relationships between variables. Because both methods involve relationships between variables, they are sometimes confused. However, they answer different research questions and should not be treated as interchangeable.
Quick answer
Correlation measures how strongly two variables move together (association). Regression predicts or explains one variable (the outcome) from one or more others (the predictors). Neither, on its own, proves cause and effect.
Understanding correlation
Correlation measures the strength and direction of association between two variables. The most commonly used measure is Pearson’s correlation coefficient, represented by r. Its value ranges from −1 to +1.
A positive correlation means that both variables tend to increase together, while a negative correlation means that one variable tends to increase as the other decreases. A value close to zero indicates a weak or negligible linear relationship.
For example, a researcher may examine whether study time is associated with examination performance. Correlation can show whether the two variables move together, but it does not establish that one variable causes the other.
Understanding regression
Regression goes a step further by examining whether one variable can predict or explain variation in another variable. The dependent variable is predicted from one or more independent variables.
For example, a researcher could use regression to determine whether study time predicts examination performance. Multiple regression can also assess several predictors simultaneously. See our step-by-step guide on how to run and interpret regression in SPSS.
When should you use each?
Use correlation when your main objective is to determine whether two variables are associated and to measure the strength and direction of that relationship.
Use regression when your research question involves prediction, explanation or assessing the contribution of one or more independent variables to a dependent variable.
| Correlation | Regression | |
|---|---|---|
| Main question | Are the variables associated? | Can one variable predict or explain another? |
| Roles of variables | Symmetric, no outcome or predictor | Predictor(s) and an outcome |
| Typical output | Correlation coefficient (r) | R², coefficients (B), significance |
| Number of variables | Usually two at a time | One outcome, one or more predictors |
The key difference
The simplest way to remember the distinction is: correlation measures association, while regression models prediction or explanation.
Correlation treats the relationship symmetrically, whereas regression assigns variables specific roles as predictors and an outcome. Therefore, choosing between them should depend on the research question rather than simply the type of data available.
Final thought
Both techniques are valuable, but neither should automatically be interpreted as evidence of causation. Researchers should consider the research design, assumptions and statistical significance before drawing conclusions. For common reading errors, see common SPSS output misinterpretations.
Related reading
Not sure whether you need correlation or regression?
Our statisticians help you choose the right analysis, run it in SPSS and explain the results in plain language.
Get SPSS helpFrequently asked questions
Is regression better than correlation?
Neither is better. Correlation answers whether two variables are associated; regression answers whether one or more variables predict an outcome. Choose the one that matches your research question.
Does a strong correlation mean causation?
No. A strong correlation shows that two variables move together, but another variable or the study design may explain the relationship.
What is the difference between r and R²?
r is the correlation coefficient showing the strength and direction of a relationship. R² in regression shows how much of the variation in the outcome is explained by the predictors.









Comments are closed