

Last updated on September 30th, 2026 at 01:16 pm
Choosing between SPSS AMOS and SmartPLS is one of the most common questions I come across when working with dissertation and thesis research. Both are powerful structural equation modeling (SEM) tools, but they are not designed around exactly the same analytical purpose.
In my view, the question should not be “Which software is better?”. The better question is: “Which SEM approach fits my research objective, theoretical model and data?” That distinction can save you from choosing software simply because a supervisor, colleague or previous dissertation used it.
SPSS AMOS vs. SmartPLS: What Is the Difference?
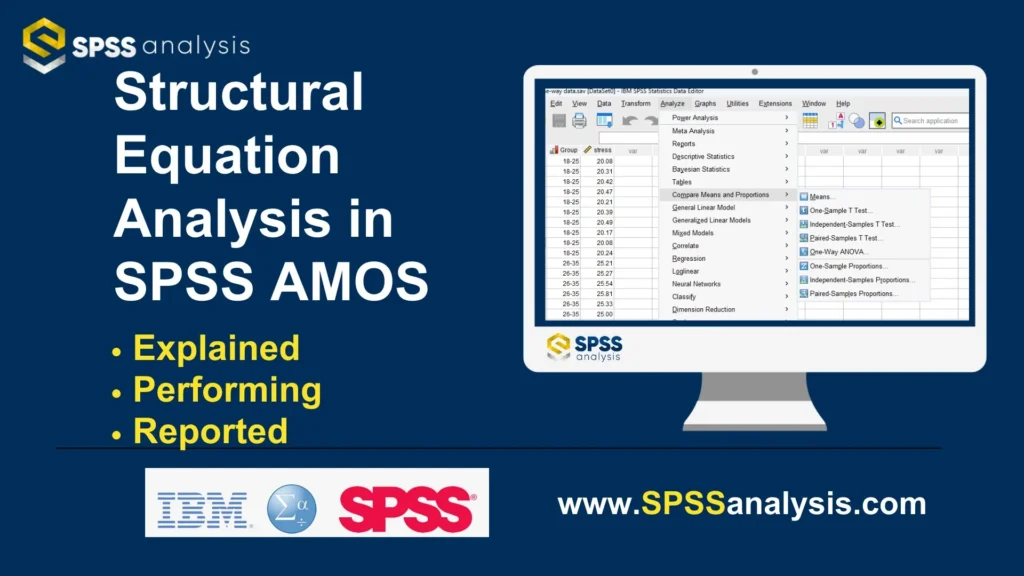
IBM SPSS AMOS is primarily associated with covariance-based SEM (CB-SEM). It is particularly useful for theory testing, confirmatory factor analysis (CFA), model confirmation and assessment of global model fit. AMOS also supports graphical model specification, path analysis and direct and indirect effects.
SmartPLS, on the other hand, is strongly associated with partial least squares structural equation modeling (PLS-SEM). It is particularly useful when the research focuses on prediction, explaining variance, complex models, formative constructs or exploratory theory development.
So, despite being compared as competing software packages, they can represent different methodological choices, not simply different interfaces.
When Should You Use SPSS AMOS?
From my experience, AMOS is often the stronger choice when your study has a well-established theoretical framework and your main objective is confirmatory analysis.
For example, suppose your research proposes that employee engagement influences job satisfaction, which then affects organisational commitment. If you are testing an established thereticoal model and want to assess CFA and overall model fit, AMOS can be a suitable choice.
When Is SmartPLS More Appropriate?
I would generally consider SmartPLS when prediction and explanation are central to the research.
It can be particularly useful for complex models involving mediation, moderation, higher-order constructs, formative measurement and multiple structural relationships. SmartPLS also provides procedures for predictive assessment, including PLSpredict and CVPAT.
However, I would not recommend choosing SmartPLS simply because your sample is small or your data are non-normal. Those factors may support the decision, but they should not be the only methodological justification.
AMOS or SmartPLS: My Practical Recommendation
Here is how I usually think about the choice:
Choose AMOS when: your priority is theory confirmation, CFA and global model fit.
Choose SmartPLS when: your priority is prediction, explained variance, formative constructs or a highly complex model.
The software should come after the research design, not before it.
A common mistake is to decide, “I will use SmartPLS because my sample is only 200,” or “I will use AMOS because everyone in my department uses it.” That is not a strong methodological justification.
Your research question, theoretical framework, measurement model, sample, data characteristics and intended conclusions should determine the SEM approach.

Common SPSS Output Misinterpretations: Why Correlation ≠ Causation Is Only Half the Story
You just finished running your statistical analysis in SPSS. Your output shows r = .42, p = .003.
It’s statistically significant! A frequent reaction for students writing an SPSS dissertation is to instantly declare that their independent variable definitively causes changes in their dependent variable

But as I frequently tell my academic consulting clients, navigating correlation vs causation is only the first hurdle in SPSS results interpretation. Here are three deeper errors students commonly make when reading their tables—and how to accurately correct them.
1. Confusing Statistical Significance with Practical Importance
The Mistake: Seeing p = .001 and assuming you have found a massive, ground-breaking effect. The Reality: A p-value only evaluates the probability of your data assuming the null hypothesis is true; it does not measure the size of your finding. The Fix: Always report the effect size. A tiny p-value paired with a negligible effect magnitude means the association is statistically significant, but practically meaningless in the real world.
2. Misreading Levene’s Test
The Mistake: Students love small p-values. When running an independent-samples t-test, they spot a Levene’s test significance of .021 and celebrate. The Reality: For Levene’s test, statistical significance means you violated the assumption of equal variances. The Fix: If Levene’s p < .05, you must read the bottom row of your SPSS output (“Equal variances not assumed”) to report the correct adjusted t-statistic.
3. The Causation Illusion
The Mistake: Treating a strong SPSS correlation as definitive proof of a mechanism. The Reality: Correlation simply measures shared variance. An unmeasured confounding variable could easily be driving both metrics. The Fix: State that your data “provides evidence for a positive association,” carefully noting that a significant correlation alone does not establish causality.
The Takeaway
Learning how to interpret SPSS results accurately requires looking beyond the significance column. Proper SPSS output interpretation means evaluating effect sizes, verifying mathematical assumptions, and discussing your findings strictly within the limitations of the analysis.
How to Read a Marker’s Rubric for a Statistics Chapter: What Examiners Are Actually Scoring
You ran the tests for your quantitative research dissertation, pasted the tables, reported the p-values, and still received a disappointing grade. Why? Because simply running tests isn’t enough. Many statistics chapter marking rubrics penalise students who treat their dissertation results chapter like a software manual rather than a cohesive scientific argument.
As a consultant, I regularly decode dissertation marking criteria. Examiners aren’t rewarding the sheer volume of your dissertation statistics. Four carefully selected analyses always beat ten poorly justified ones. Here is what they are actually evaluating.
Methodological Justification
Did you explain why you chose a specific test? A strong statistics chapter dissertation proves your chosen method specifically fits your data type and research design.
Assumption Checking
Did you demonstrate an awareness of mathematical rules? Simply running an SPSS dissertation analysis without checking normality or evaluating Levene’s test loses marks immediately.
Interpretation vs. Description
Markers want accurate SPSS results interpretation, not a regurgitated list of numbers.
- Weak: “ANOVA showed p = .021.”
- Stronger: “The one-way ANOVA indicated a statistically significant difference between the groups, followed by appropriate post-hoc analysis to identify where the differences occurred.”
The second demonstrates actual statistical reasoning, whereas the first just repeats output.
Effect Size and Practicality
Did you consider the magnitude of the finding? Relying solely on statistical significance while ignoring effect size reveals a shallow understanding of your statistical analysis dissertation project.
Alignment with Hypotheses
Every analysis must clearly answer a stated hypothesis. Extraneous testing looks like fishing for significance.
The Final Takeaway
When figuring out how to write a statistics chapter, remember this: “the goal is not to show the examiner how well you navigate software. The goal is to demonstrate that you can make, justify, and interpret appropriate statistical decisions to answer your research questions”

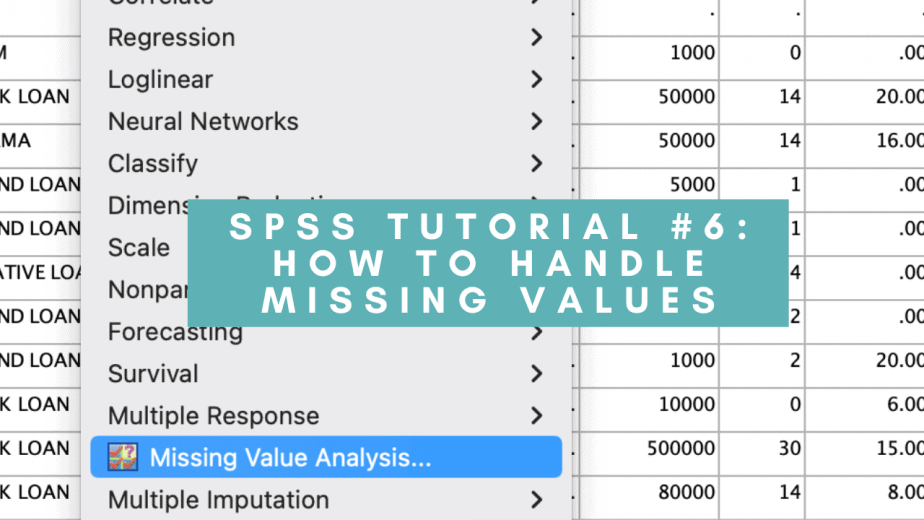
How to Handle Missing Data in SPSS: Listwise Deletion vs. Multiple Imputation
You’ve finally collected 300 questionnaires for your SPSS dissertation, but panic sets in when opening your dataset. Several respondents skipped key questions. Your immediate temptation during SPSS data cleaning is to simply delete those incomplete cases and move on. But should you remove them, or impute them? Handling missing values properly determines the integrity of your findings.
Why Missing Data Matters
Unaddressed missing data in SPSS silently damages quantitative research. It shrinks your sample size, reduces statistical power, inflates standard errors, and skews parameter estimates. Ultimately, mishandling missing observations threatens the validity of your conclusions. The precise amount and pattern of missingness must dictate your solution.
Listwise Deletion
Listwise deletion completely removes any case with missing data from an analysis. If 30 of your 300 respondents skipped a variable used in your regression model, listwise deletion drops them entirely, reducing your usable sample to 270. It is incredibly simple and computationally easy to interpret. However, it sacrifices statistical power and introduces severe bias if those deleted cases differ systematically from your complete cases.
Multiple Imputation
Multiple imputation in SPSS provides a more mathematically robust alternative. Rather than substituting a simple mean this method uses information from other observed variables to predict plausible values. It generates multiple simulated datasets, analyses each, and pools the results together. This preserves your sample size while accurately reflecting the inherent uncertainty of your missing data analysis.
The Missingness Mechanism
Your choice depends entirely on why data is missing. Is it Missing Completely At Random (MCAR), Missing At Random (MAR), or Missing Not At Random (MNAR)? If data is strictly MCAR, listwise deletion might only cost you power. If it’s MAR or MNAR, deleting cases likely biases your results, making imputation necessary.
Making the Right Choice
There is no universally correct method. Do not automatically choose multiple imputation SPSS procedures just to look sophisticated, and do not default to listwise deletion just because it requires fewer clicks. Before deciding how to handle missing data in SPSS, you must:
- Inspect the exact amount and pattern of SPSS missing values.
- Check if specific variables or demographics are disproportionately affected.
- Document and justify your chosen treatment clearly.
The Takeaway
The best approach is rarely the most convenient one. Your goal is to choose a defensible method, justify it analytically, apply it consistently, and report its implications transparently in your methodology chapter.
Python vs. SPSS for Statistical Analysis: Which Should Students Learn?
Choosing between Python and SPSS for statistical analysis can be confusing for students, especially when both tools are widely used in academic research. From my own experience, I have used both Python and SPSS since my MBA, and I have found that each has its own strengths.
My Experience with SPSS
I first used SPSS for statistical analysis during my MBA. What I liked most was its simple interface. I could perform descriptive statistics, correlation, regression, t-tests, ANOVA, reliability analysis using Cronbach’s alpha, and factor analysis without writing code. The quick results, statistical output tables and graphs made SPSS particularly convenient for academic research.
My Experience with Python
I also started using Python during my MBA, and my experience was quite different. I worked with Pandas, data cleaning, statistical analysis, visualisation, machine learning and prediction. I also worked with concepts such as confusion matrices and epochs. What I particularly liked about Python was the ability to work with large datasets smoothly and perform analysis through coding.
Python vs. SPSS: Which Should Students Learn?
There is no hard-and-fast rule that students must choose Python over SPSS or vice versa. SPSS can be an excellent starting point for students who want straightforward statistical analysis without programming. Python, however, can provide broader skills in data analytics, machine learning, automation and programming. Based on my experience, I would recommend that students consider learning both if they have enough time. SPSS can make statistical analysis easier to approach, while Python can develop more flexible and transferable technical skills.
Ultimately, the best choice depends on your research requirements, technical interests and career goals. Rather than asking which software is universally better, students should ask which tool is better for the type of analysis they want to perform.
Beyond Pandas: When to Use Statsmodels or Pingouin for Statistical Testing in Python
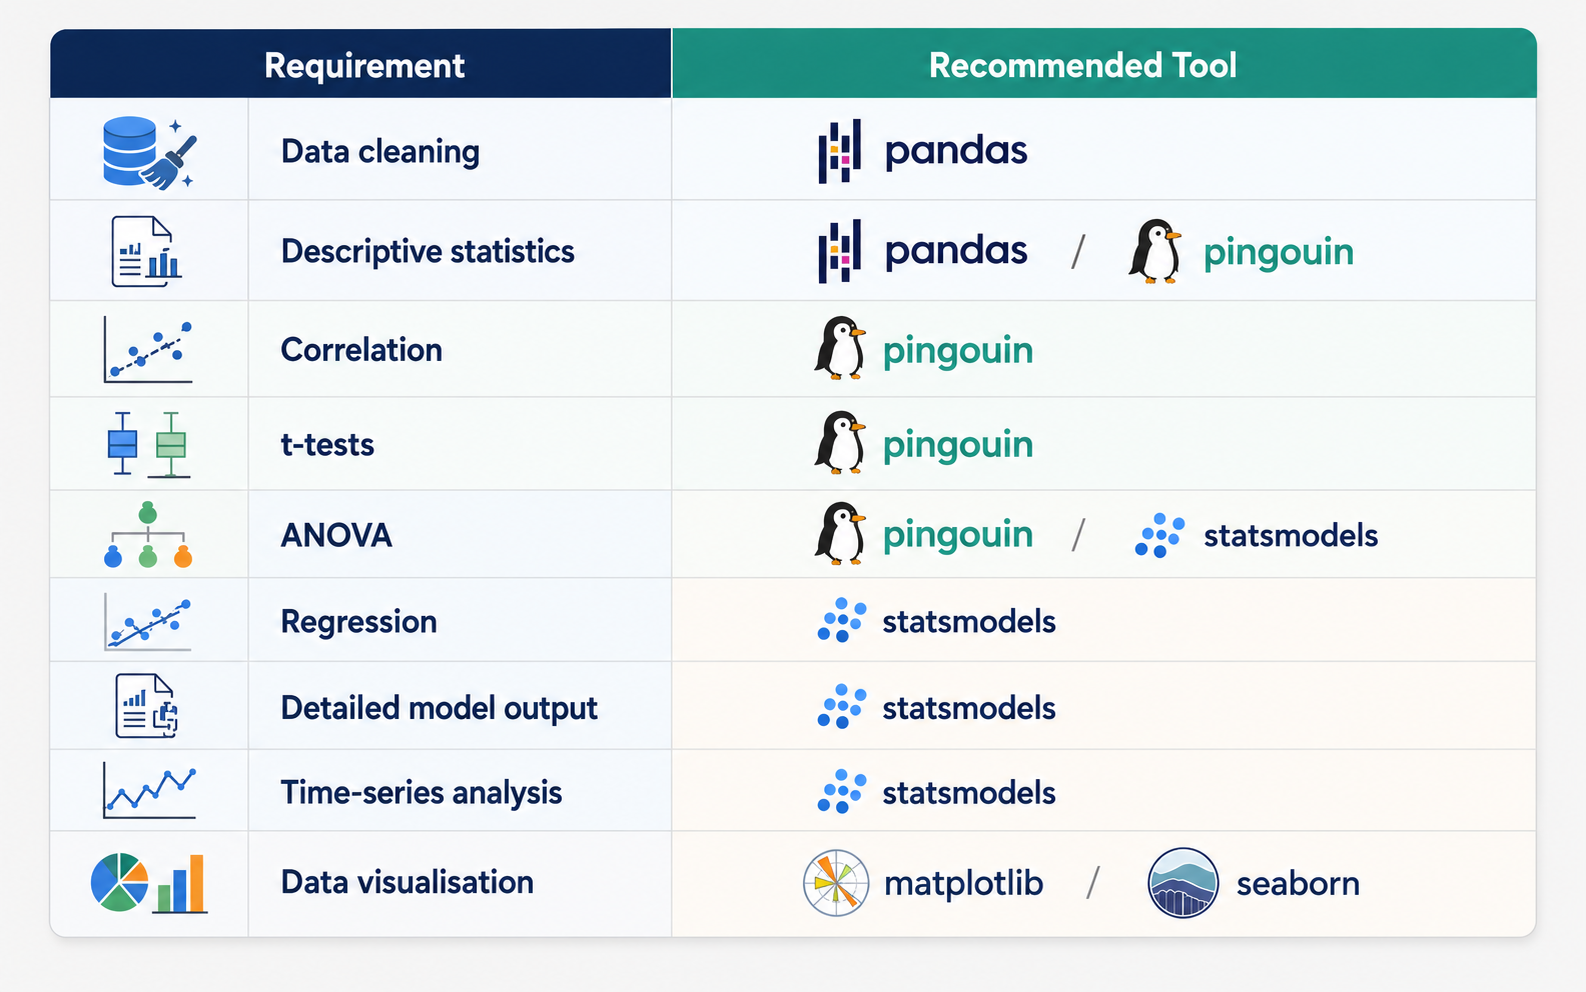
Pandas is one of the first Python libraries students learn for data analysis. It is excellent for cleaning, organising and exploring datasets, but it is not designed to handle every statistical test. When you need correlation, t-tests, ANOVA, regression or detailed statistical modelling, libraries such as Pingouin and Statsmodels become much more useful.
Pandas Is Only the Beginning
Pandas is extremely useful for importing, cleaning, filtering and organising data. It can also calculate basic descriptive statistics such as means, standard deviations and counts.
However, academic research often requires more than descriptive statistics. For a dissertation, you may need to test relationships between variables, compare groups or determine whether a result is statistically significant.
This is where specialised Python statistical libraries can make your analysis easier.
When Should You Use Statsmodels?
Statsmodels is particularly useful for statistical modelling and statistical inference. It supports methods such as ordinary least squares (OLS) regression, logistic regression, generalized linear models, ANOVA and time-series analysis.
One of its biggest strengths is its detailed statistical output. Depending on the model, you can obtain coefficients, standard errors, p-values, confidence intervals, R-squared values and diagnostic information.
This makes Statsmodels Python particularly useful for academic research, where understanding and reporting statistical results is often as important as making predictions.
When Should You Use Pingouin?
Pingouin focuses on making many common statistical procedures straightforward to perform in Python. It supports analyses such as correlation, t-tests, ANOVA, non-parametric tests and effect-size calculations.
For students who are learning statistical testing in Python, Pingouin can be a convenient starting point because many analyses can be performed with relatively simple code.
Statsmodels vs. Pingouin: What Is the Difference?
In simple terms, use Pingouin for many common statistical tests and Statsmodels when you need detailed statistical modelling and inference.
Experience with Python Statistics
In my own experience using Python for data analysis, I initially worked extensively with Pandas for data cleaning and preparation. As I moved towards more advanced analysis, I realised that Python becomes much more powerful when different libraries are used for different purposes.
A practical workflow can be:
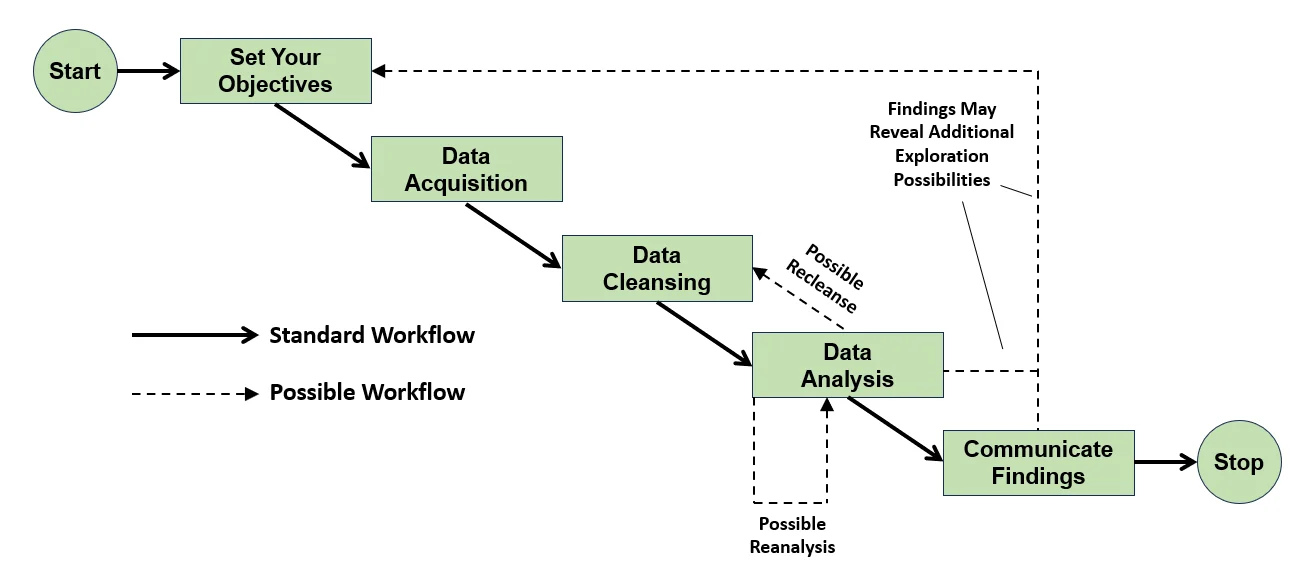
Pandas → Clean and prepare data → Pingouin/Statsmodels → Perform statistical analysis → Matplotlib/Seaborn → Visualise results → Interpret findings
This approach is more flexible than trying to use a single Python library for the entire analysis.
Which Should Students Learn?
There is no single library that is best for every situation.
If you mainly need common statistical tests such as correlations, t-tests or ANOVA, Pingouin is a good option to learn. If your research involves regression, statistical modelling, diagnostics or time-series analysis, Statsmodels is particularly valuable.
For students interested in academic research, a combination of Pandas, Pingouin and Statsmodels can provide a strong foundation for statistical analysis in Python.
FAQ
Reproducible Python Analysis: Why ‘It Ran on My Laptop’ Isn’t Good Enough for a Dissertation Appendix
When students complete a dissertation using Python, the main focus is usually on getting the analysis and results correct. I have experienced this myself while working with Python for data analysis, machine learning and research. But there is another issue that is easy to overlook: will the same code work on another computer?
A Python script may run perfectly on your laptop but fail when your supervisor or another researcher tries to execute it. This is where reproducible Python analysis becomes important.
What Does Reproducibility Mean in Python?
Reproducibility means that another person should be able to understand your analytical process and, where possible, run the same code and obtain comparable results.
When I started working with Python, libraries such as Pandas made data analysis relatively straightforward. However, as projects became more advanced and involved machine learning and statistical analysis, I realised that the code itself was only one part of the project. The Python environment also matters.
Why “It Worked on My Laptop” Is Not Enough
Imagine that your dissertation uses Pandas, NumPy, Scikit-learn, Statsmodels and Matplotlib. Your code works correctly today, but several months later a library has been updated.
A supervisor running your code may then receive an error even though your original analysis worked.
I have found that this becomes particularly important when working with machine-learning workflows, where different package versions can affect how code, models or functions behave.
What Should Students Document?
A simple solution is to create a requirements.txt file containing the packages required by your project.
For example:
pandas
numpy
scikit-learn
statsmodels
matplotlib
seaborn
You can make this even more useful by recording the package versions you actually used.
Using a virtual environment is another good practice. It keeps the dependencies for one research project separate from other Python projects on your computer.
What Should Go in a Dissertation Appendix?
Based on my experience, students should think beyond simply attaching a .py file. A useful appendix can include:
- Python version
- Required libraries and versions
- requirements.txt
- Source code
- Data-processing steps
- Instructions for running the code
- Relevant model or analysis settings
This makes it easier for someone else to understand how your results were produced.
Python vs. R for Specific Disciplines: What Psychology, Business, and Biology Departments Actually Expect
Python vs. R is a common question among students learning data analysis, statistics and research. Both languages are powerful, but the right choice depends on your academic discipline, research requirements and career goals. Psychology, business and biology students may have different reasons for choosing Python or R.
Python vs. R: What Is the Difference?
Python is a general-purpose programming language widely used for data analysis, machine learning, automation and artificial intelligence. Libraries such as Pandas, NumPy, Scikit-learn and Matplotlib make Python suitable for many analytical tasks.
R was developed with a stronger focus on statistics, data analysis and visualisation. It is particularly useful for statistical modelling, research and exploratory analysis.
Python vs. R for Psychology Students
Psychology students often work with surveys, experiments and statistical tests. R can be a strong choice when the main focus is statistical analysis, modelling and research visualisation. Python becomes particularly useful when projects involve text analysis, machine learning or natural language processing.
Python vs. R for Business Students
For business students, Python can be especially valuable because it combines data cleaning, analytics, automation, prediction and machine learning. These skills can be applied to customer analytics, sales forecasting, financial analysis and business intelligence.
Python vs. R for Biology Students
Biology students can benefit from either language. R is useful for statistical analysis and research visualisation, while Python can be advantageous for large datasets, computational analysis and machine learning applications.
My Experience with Python and R
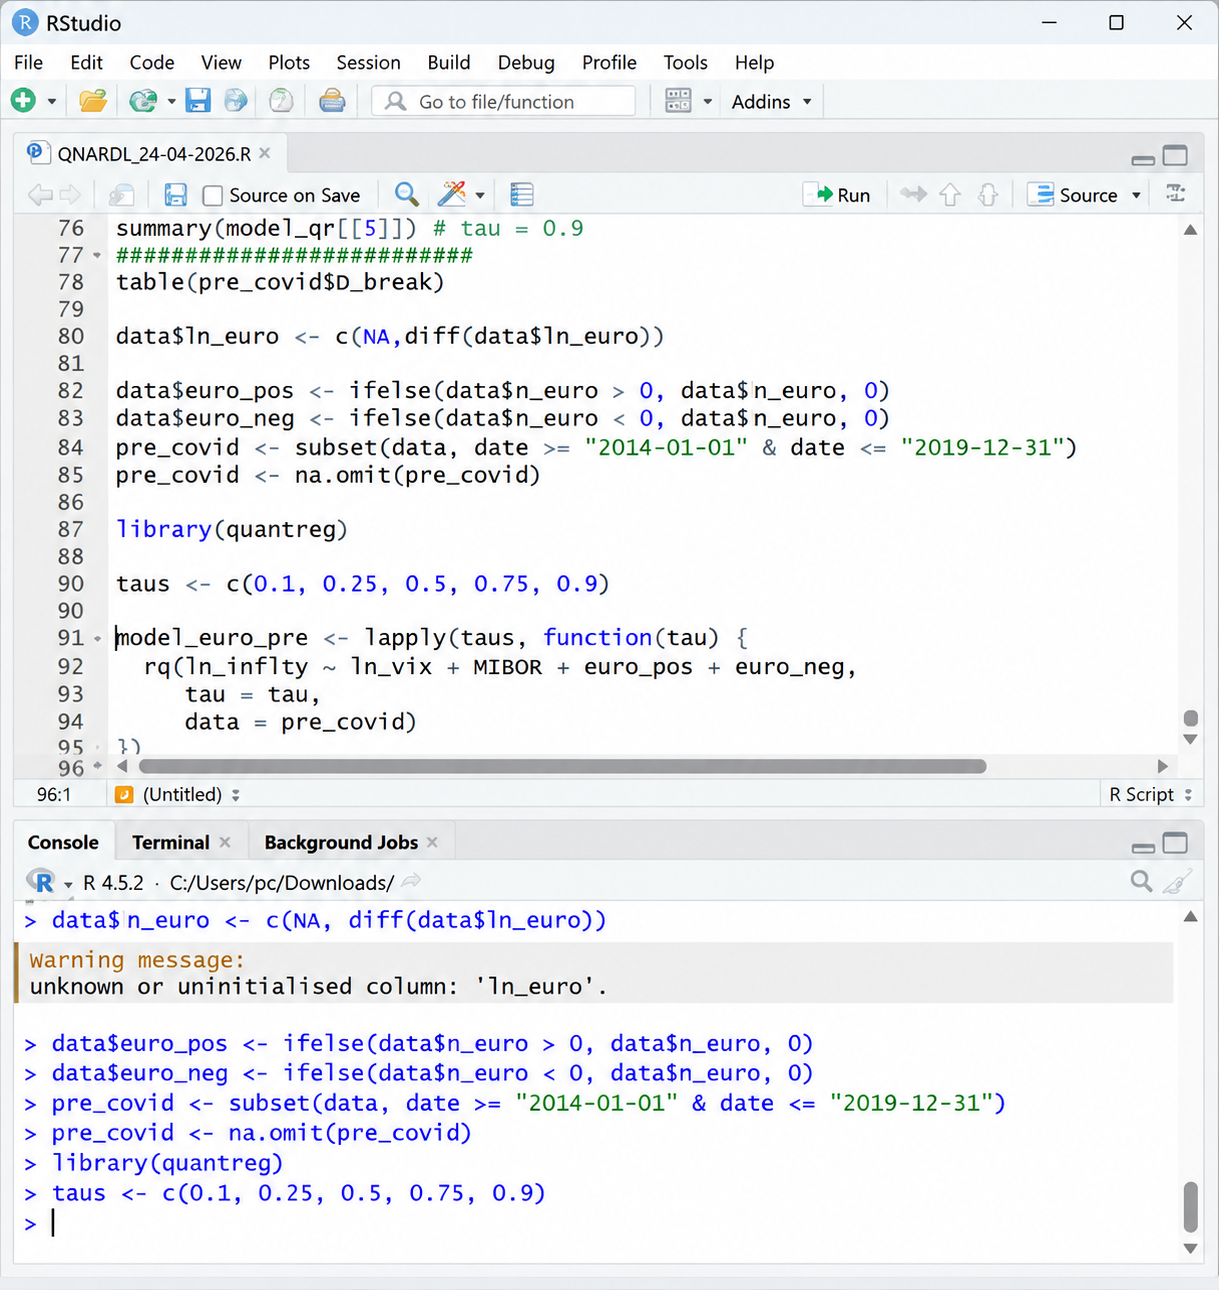
My own experience has shown me that there is no simple winner. I have used R for commodity-price analysis and bibliometric analysis, where statistical analysis and understanding patterns in research data were important. I have also used Python for data cleaning, visualisation, machine learning, prediction and handling large datasets.
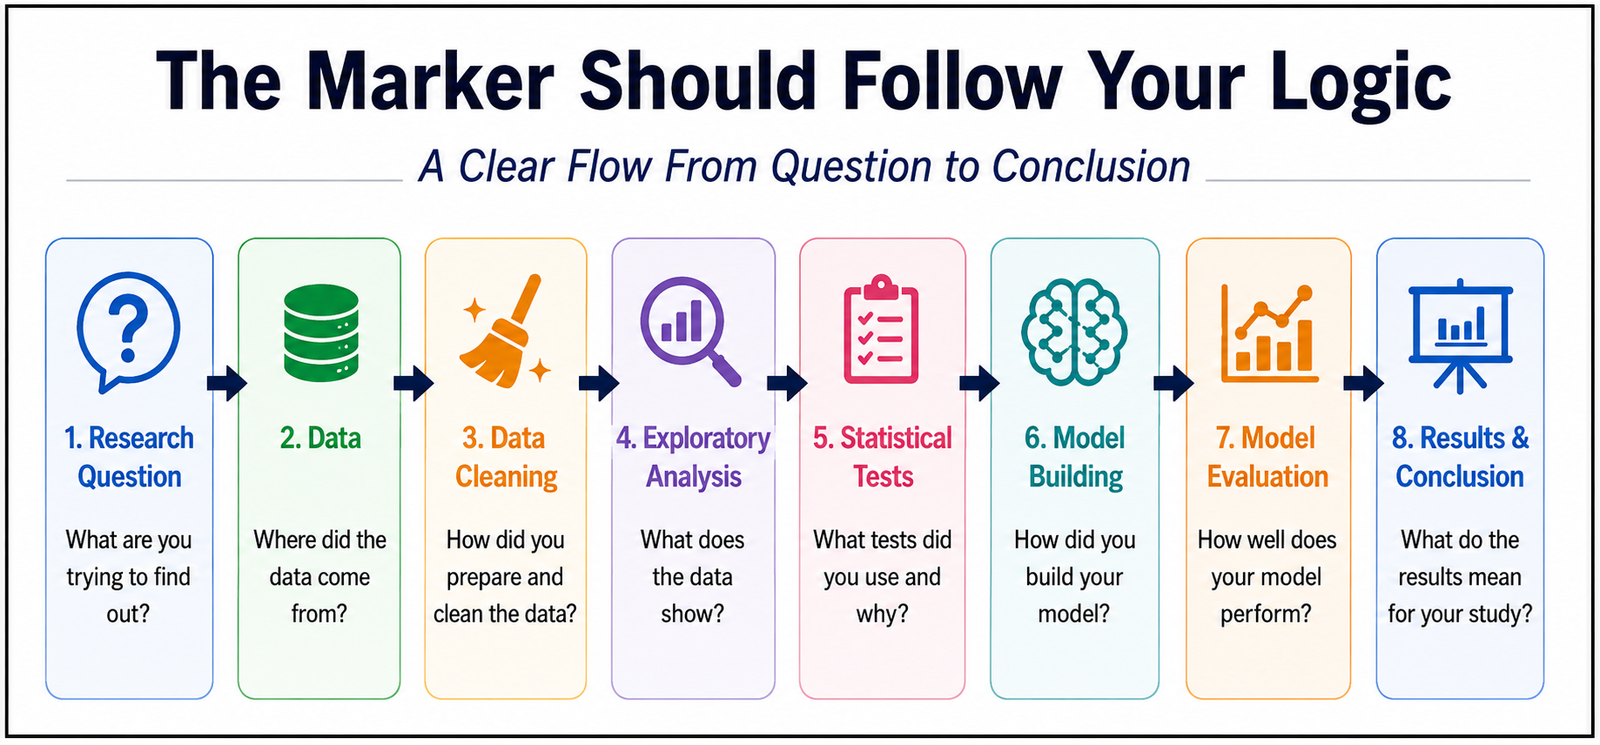
How to Document a Python Data Analysis Script So a Marker Can Follow Your Logic
1. Start With the Research Objective
Do not begin with dozens of lines of code without explaining the purpose.
# Objective:
# Examine the relationship between study hours
# and students’ academic performance.
This immediately gives the marker context.
2. Divide Your Analysis Into Sections
A long script becomes much easier to follow when it has a logical structure:
1. Import libraries
2. Load dataset
3. Data cleaning
4. Descriptive statistics
5. Exploratory analysis
6. Statistical testing
7. Model development
8. Model evaluation
9. Visualisation
This is particularly helpful when your analysis contains several stages.
3. Comment on Decisions, Not Obvious Code
Avoid comments such as:
df = pd.read_csv(“data.csv”) # Load data
Instead, explain an analytical decision:
# Remove records with missing values in variables
# required for the regression analysis.
df = df.dropna(subset=[“age”, “income”])
The goal is to help the marker understand your reasoning, not translate every line of Python.
4. Explain Your Statistical Tests
If you perform correlation, regression, ANOVA or another statistical test, explain why you selected it. This connects your code with your research methodology.
5. My Experience With Python
When I first started working with Python, my priority was simply getting the code to run. As my projects became more complex, particularly with data cleaning, statistical analysis, machine learning, prediction and model evaluation, I realised that working code is not necessarily understandable code.
Clear sections and meaningful comments made it much easier to return to my own analysis and understand what I had done.
How to Run and Interpret a Regression Analysis in SPSS (Step-by-Step)
Description: Learn how to perform a regression analysis in SPSS and interpret the key statistical outputs, including R, R², ANOVA, significance values and regression coefficients.
Regression analysis is one of the most useful statistical techniques for researchers who want to understand whether one variable can predict or explain another. Although regression may initially appear complicated, SPSS makes the process relatively straightforward. The key is knowing which variables to select and how to interpret the output correctly.
Understanding Regression Analysis
Regression analysis examines the relationship between a dependent variable and one or more independent variables. For example, a researcher may investigate whether customer satisfaction predicts customer loyalty. In simple regression, there is one independent variable, while multiple regression involves two or more predictors.
The basic regression equation is:
Y = a + bX + e
where Y represents the dependent variable, a is the constant, b is the regression coefficient, X is the independent variable and e represents the error term.
Running Regression in SPSS
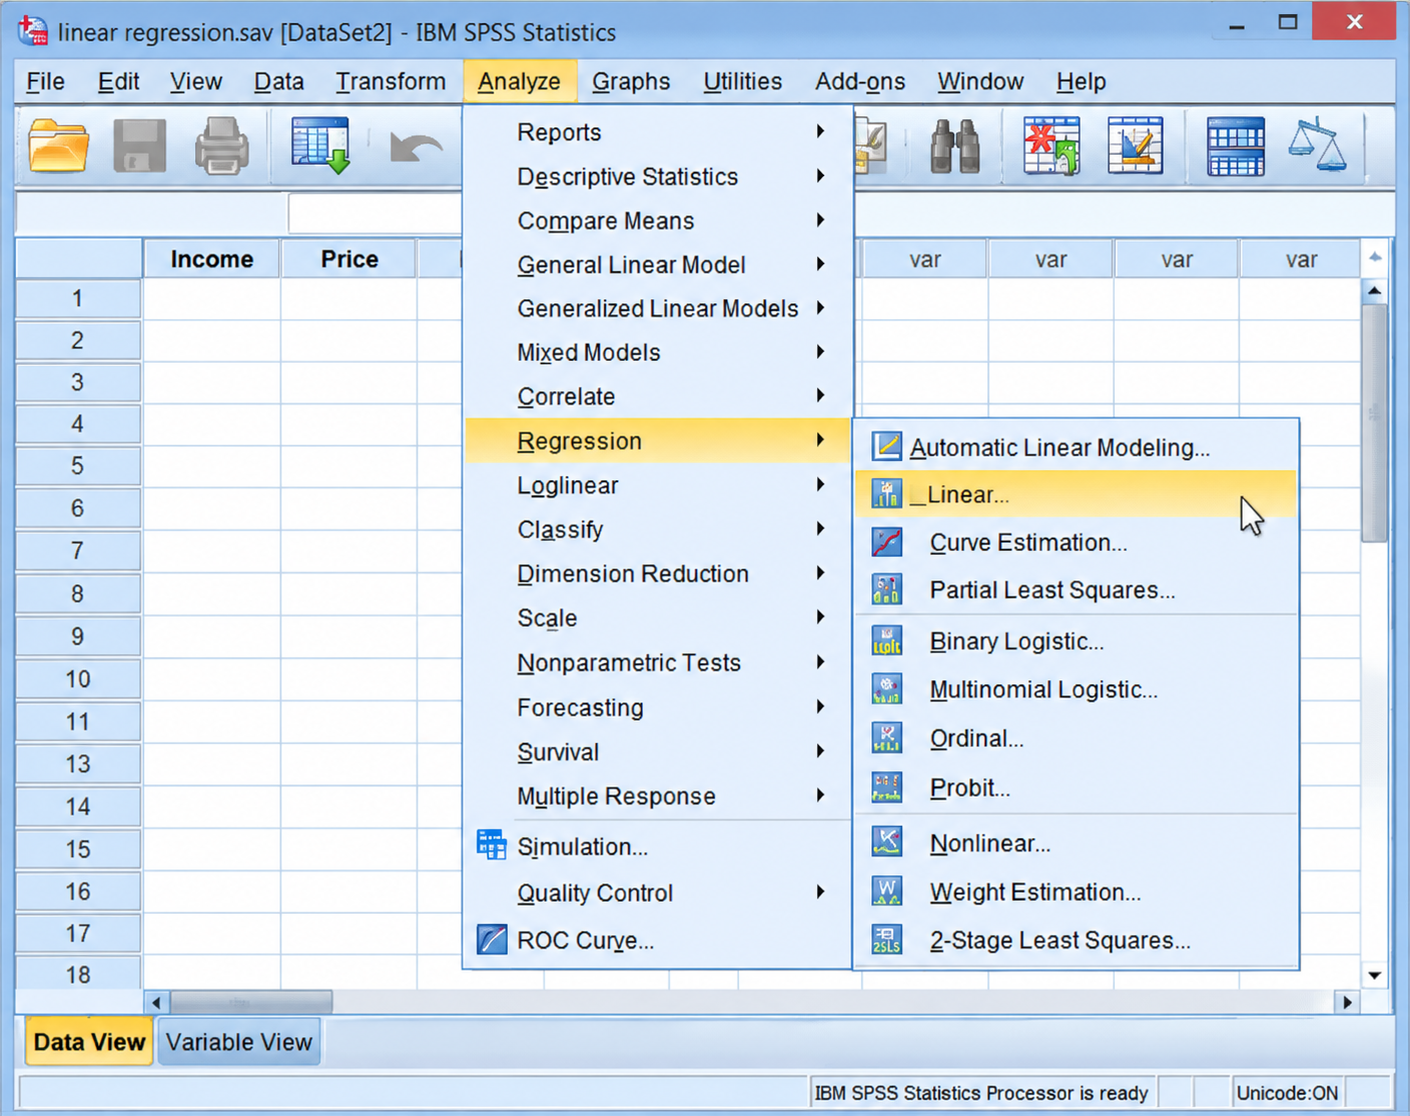
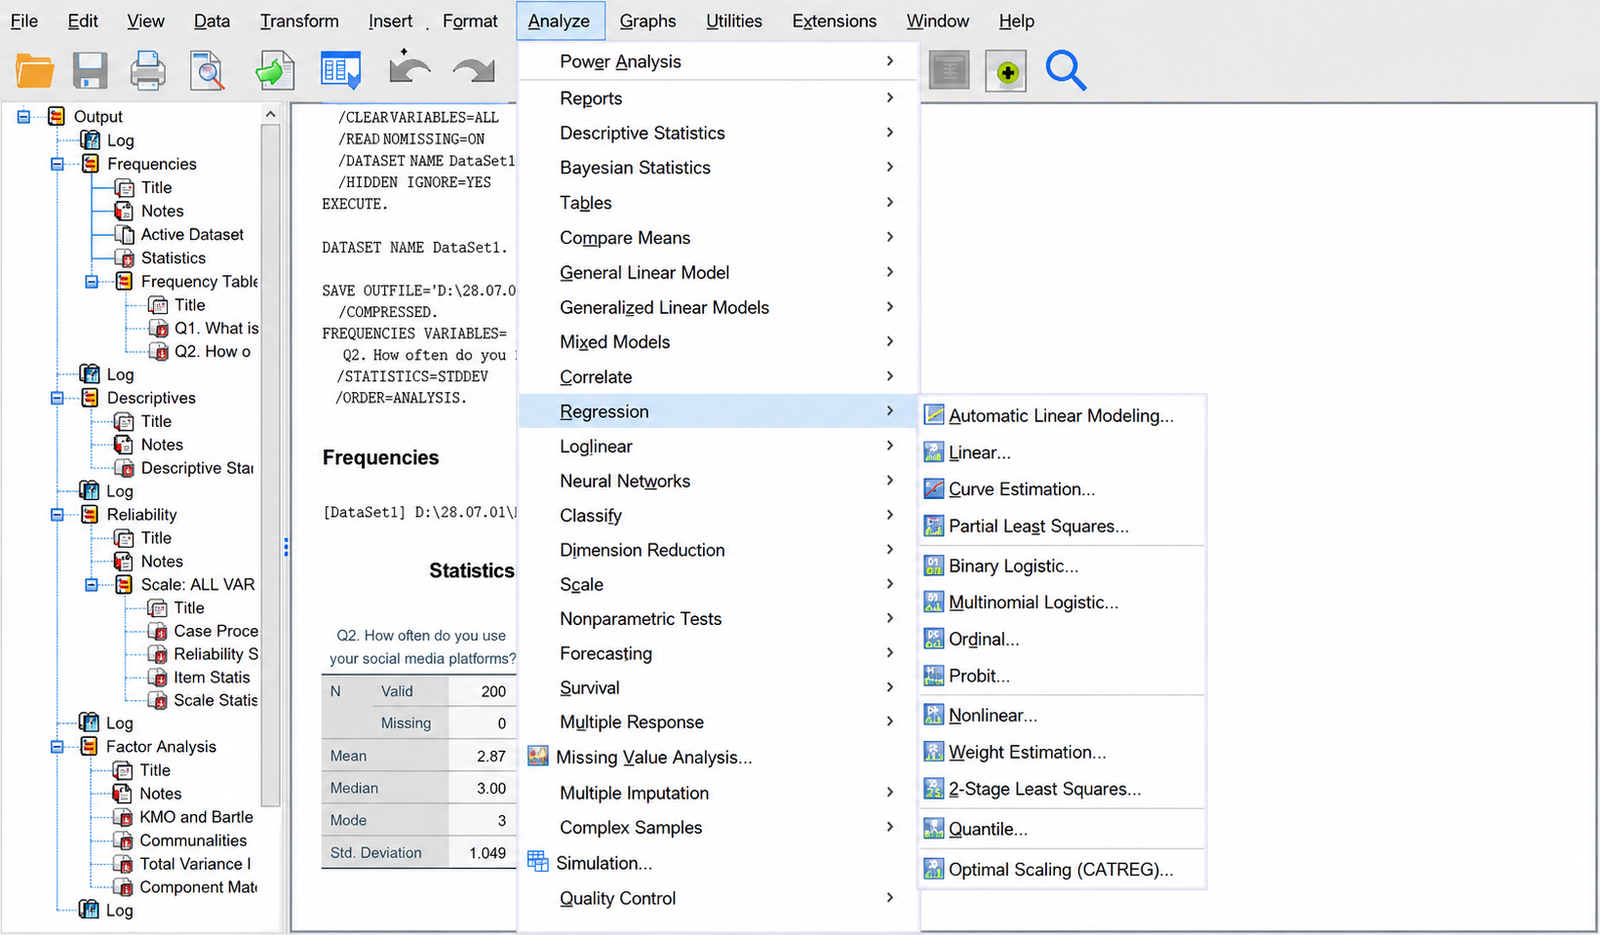
Begin by entering your dataset into SPSS and ensuring that the variables are correctly coded. Select Analyze → Regression → Linear. Move the dependent variable into the Dependent box and the predictor variable or variables into the Independent (s) box.
Under Statistics, select options such as estimates, model fit and confidence intervals. Click Continue and then OK to generate the results.
Interpreting the SPSS Output
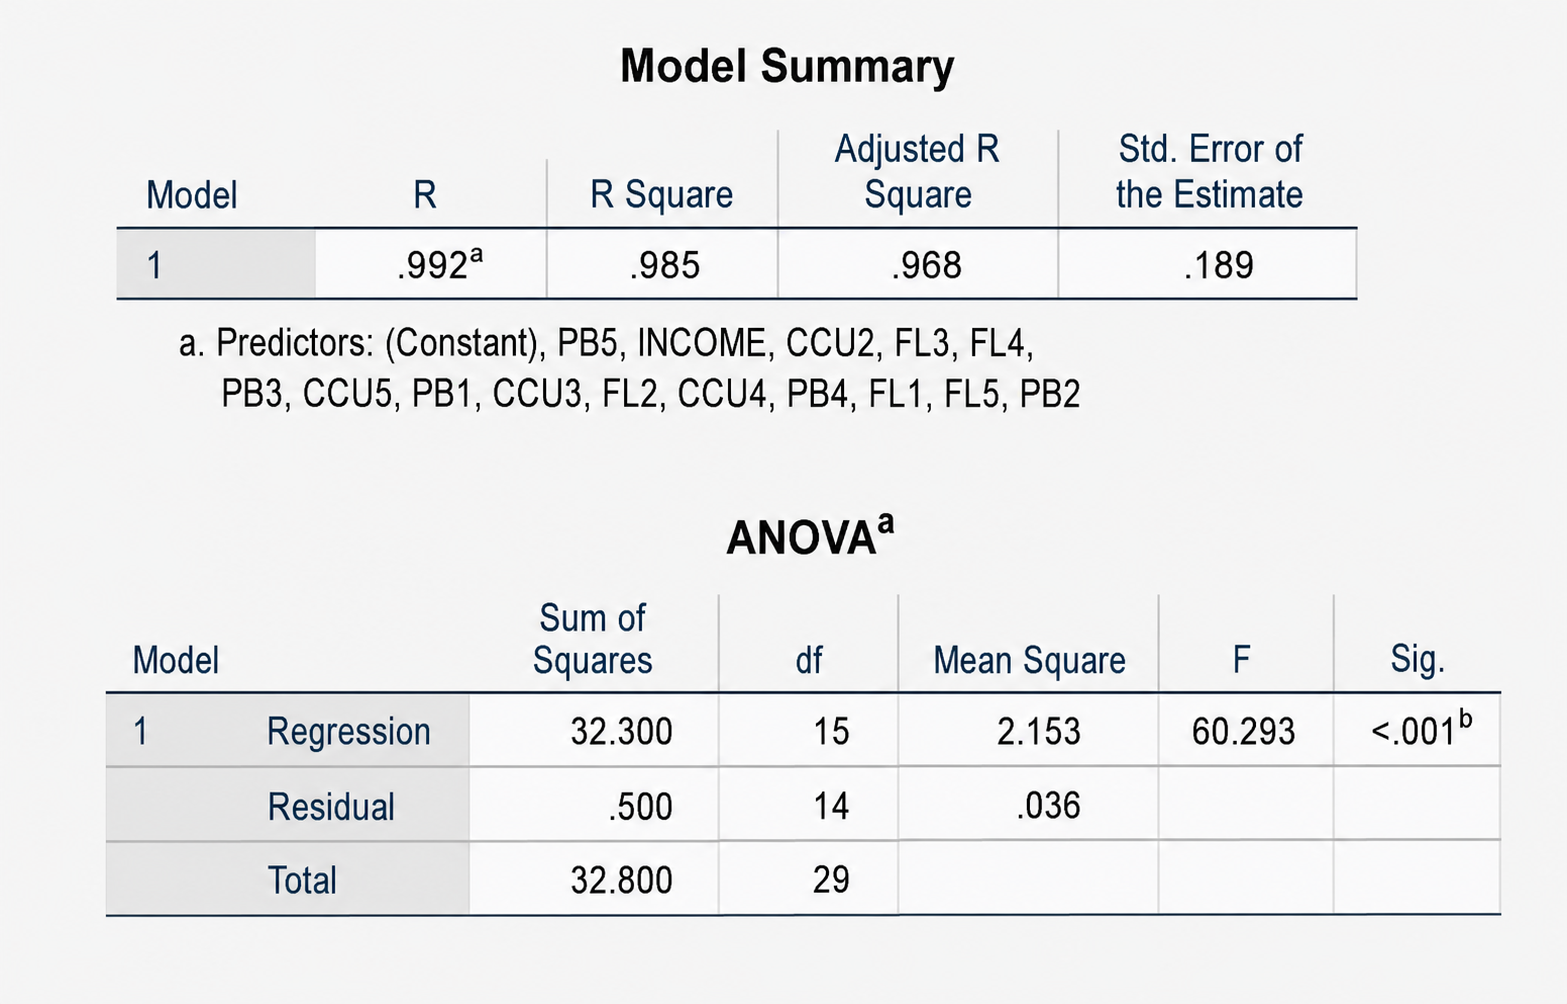
The Model Summary provides R and R². R indicates the strength of the relationship between the observed and predicted values, while R² shows how much variation in the dependent variable is explained by the predictors.
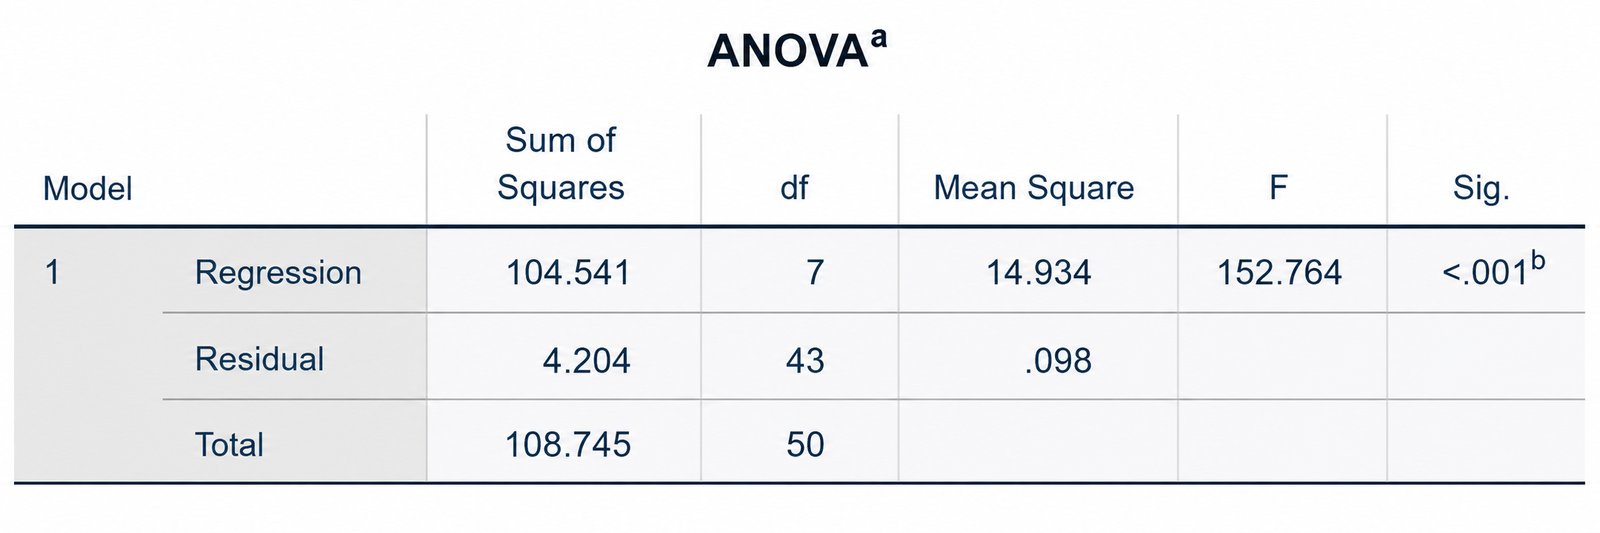
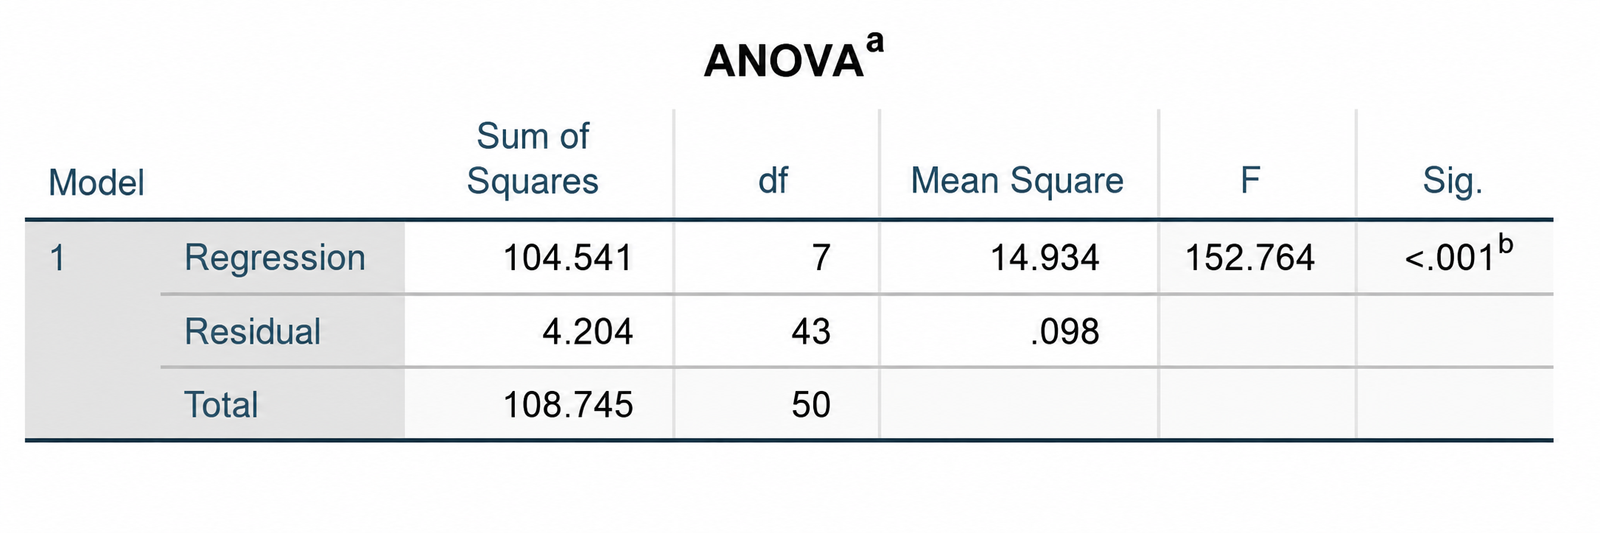
The ANOVA table helps determine whether the overall regression model is statistically significant. A significance value below 0.05 is commonly interpreted as evidence that the model provides a statistically significant prediction.
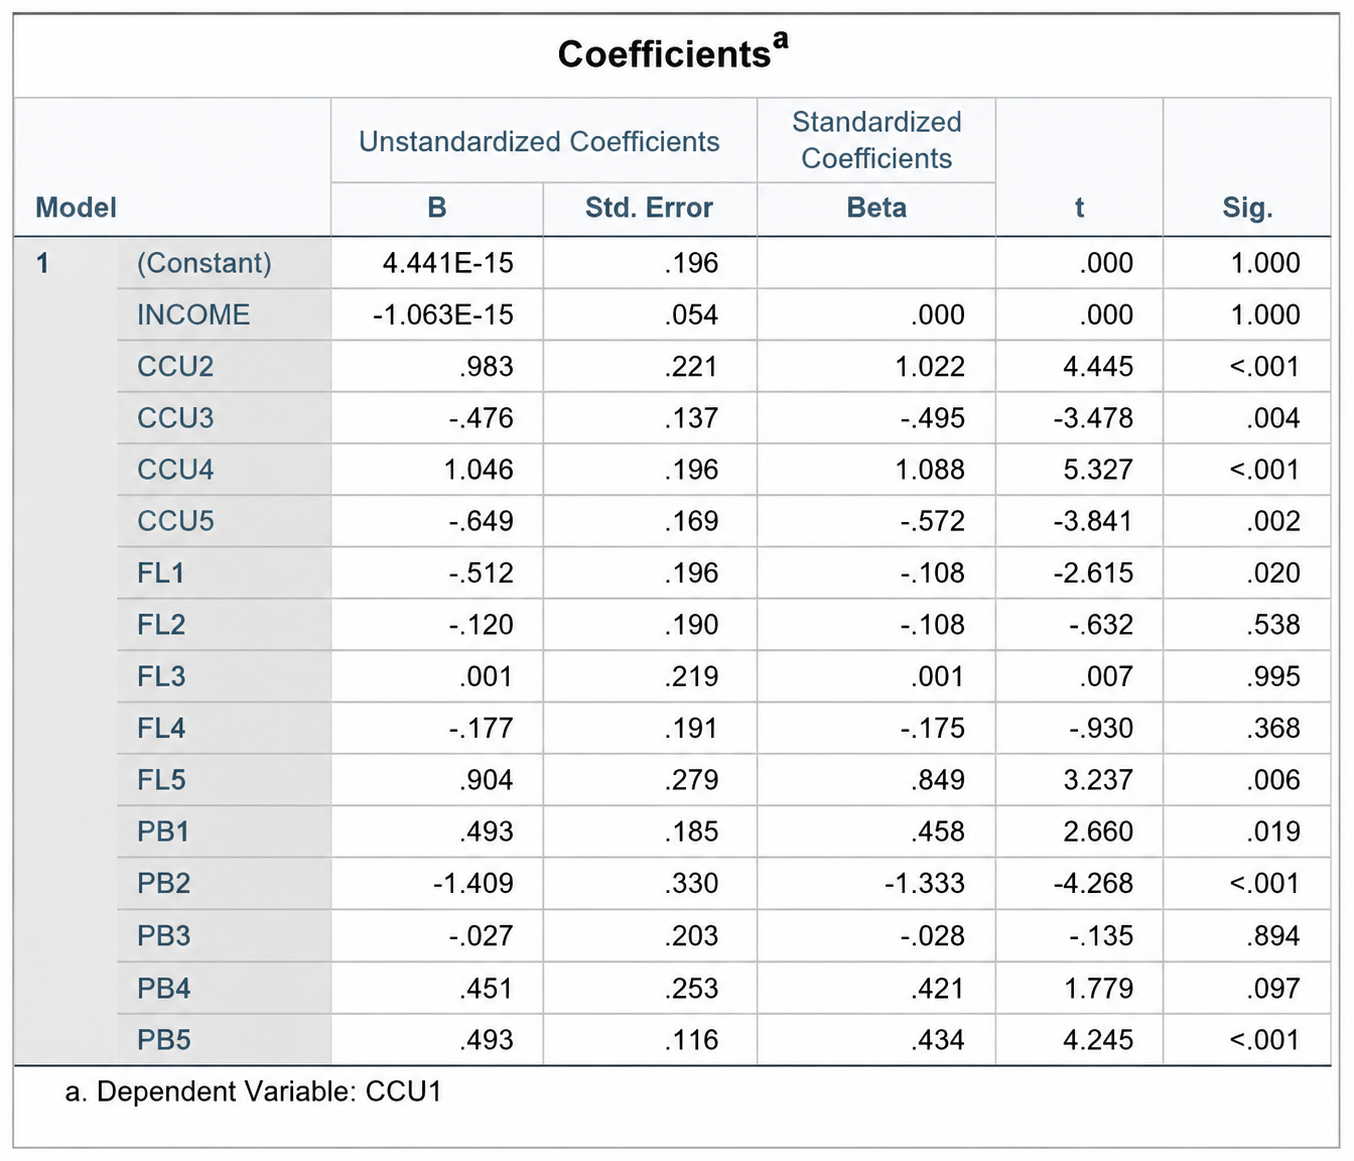
The Coefficients table provides the regression coefficient (B), standard error, t-value and significance level. A significant p-value indicates that the predictor makes a statistically significant contribution to explaining the dependent variable.
Final Interpretation
SPSS does not replace statistical reasoning. Researchers should interpret the direction, strength and significance of relationships together rather than focusing on one number. A well-reported regression analysis explains what the model means and how the findings answer the research question.
Correlation vs. Regression: What’s the Difference and When to Use Each”
Description: Understand the difference between correlation and regression, when each technique should be used, and how researchers can interpret their statistical results effectively.
Correlation and regression are two commonly used statistical techniques for examining relationships between variables. Because both methods involve relationships between variables, they are sometimes confused. However, they answer different research questions and should not be treated as interchangeable.
Understanding Correlation
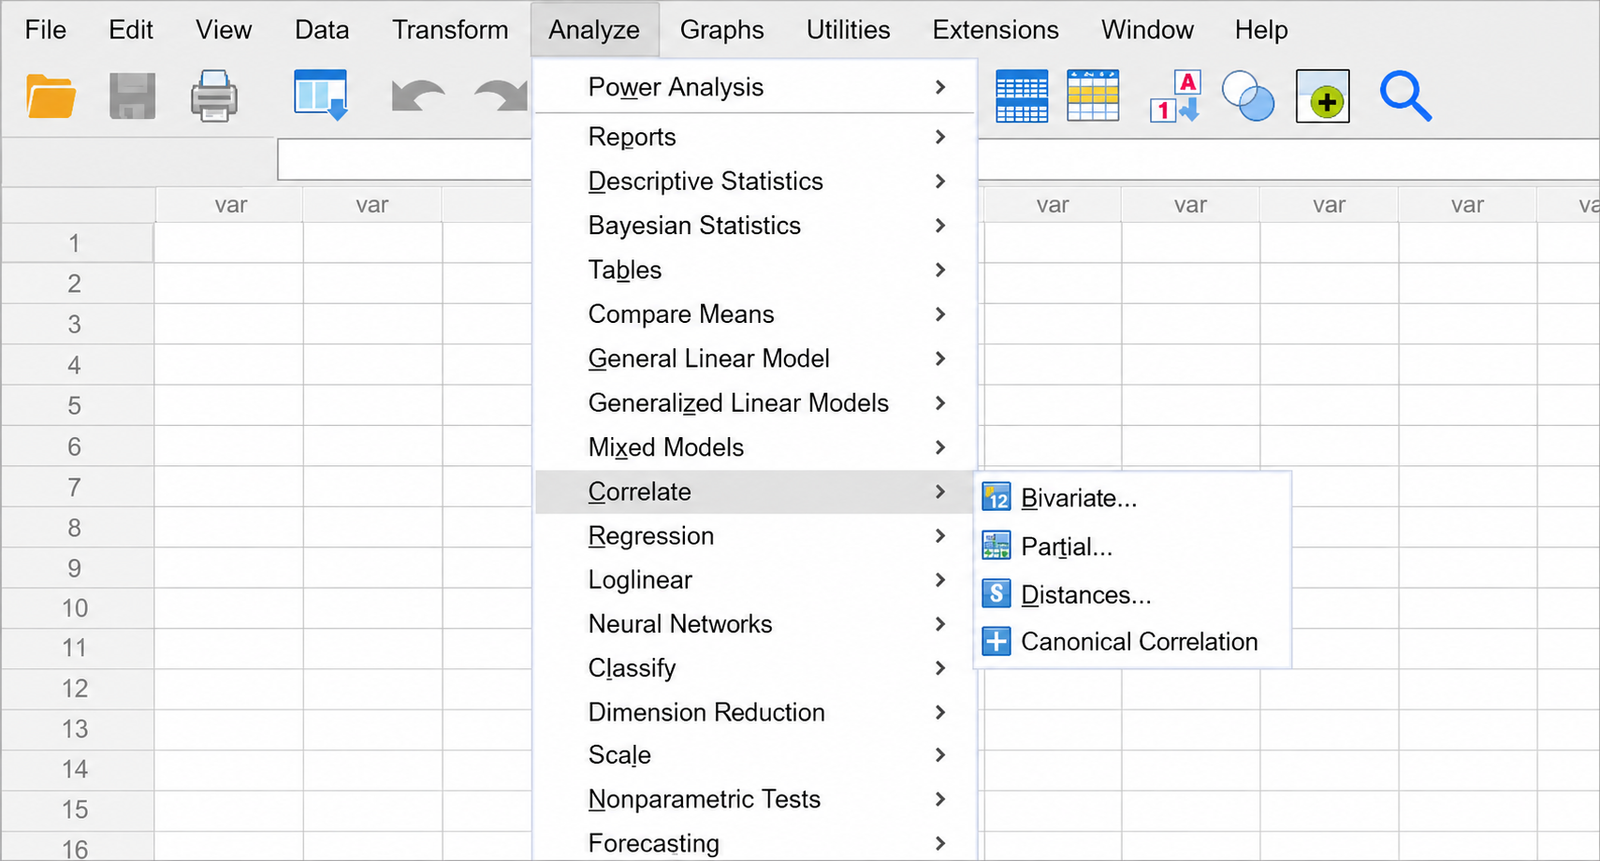
Correlation measures the strength and direction of association between two variables. The most commonly used measure is Pearson’s correlation coefficient, represented by r. Its value ranges from -1 to +1.
A positive correlation means that both variables tend to increase together, while a negative correlation means that one variable tends to increase as the other decreases. A value close to zero indicates a weak or negligible linear relationship.
For example, a researcher may examine whether study time is associated with examination performance. Correlation can show whether the two variables move together, but it does not establish that one variable causes the other.
Understanding Regression
Regression goes a step further by examining whether one variable can predict or explain variation in another variable. The dependent variable is predicted from one or more independent variables.
For example, a researcher could use regression to determine whether study time predicts examination performance. Multiple regression can also assess several predictors simultaneously.
When Should You Use Each?
Use correlation when your main objective is to determine whether two variables are associated and to measure the strength and direction of that relationship.
Use regression when your research question involves prediction, explanation or assessing the contribution of one or more independent variables to a dependent variable.
The Key Difference
The simplest way to remember the distinction is: correlation measures association, while regression models prediction or explanation.
Correlation treats the relationship symmetrically, whereas regression assigns variables specific roles as predictors and an outcome. Therefore, choosing between them should depend on the research question rather than simply the type of data available.
Final Thought
Both techniques are valuable, but neither should automatically be interpreted as evidence of causation. Researchers should consider the research design, assumptions and statistical significance before drawing conclusions.
T-Test vs. ANOVA: Which Statistical Test Should You Use? — classic “which test do I need” query, strong informational intent
Description: Understand the key differences between t-tests and ANOVA, learn when each statistical test should be used, and avoid common mistakes when selecting the appropriate test for your research data.
Choosing the correct statistical test is one of the most important decisions in quantitative research. Two commonly used tests are the t-test and Analysis of Variance (ANOVA). Both are designed to compare group means, but the appropriate choice depends mainly on the number of groups being compared and the structure of the research question.
Understanding the T-Test
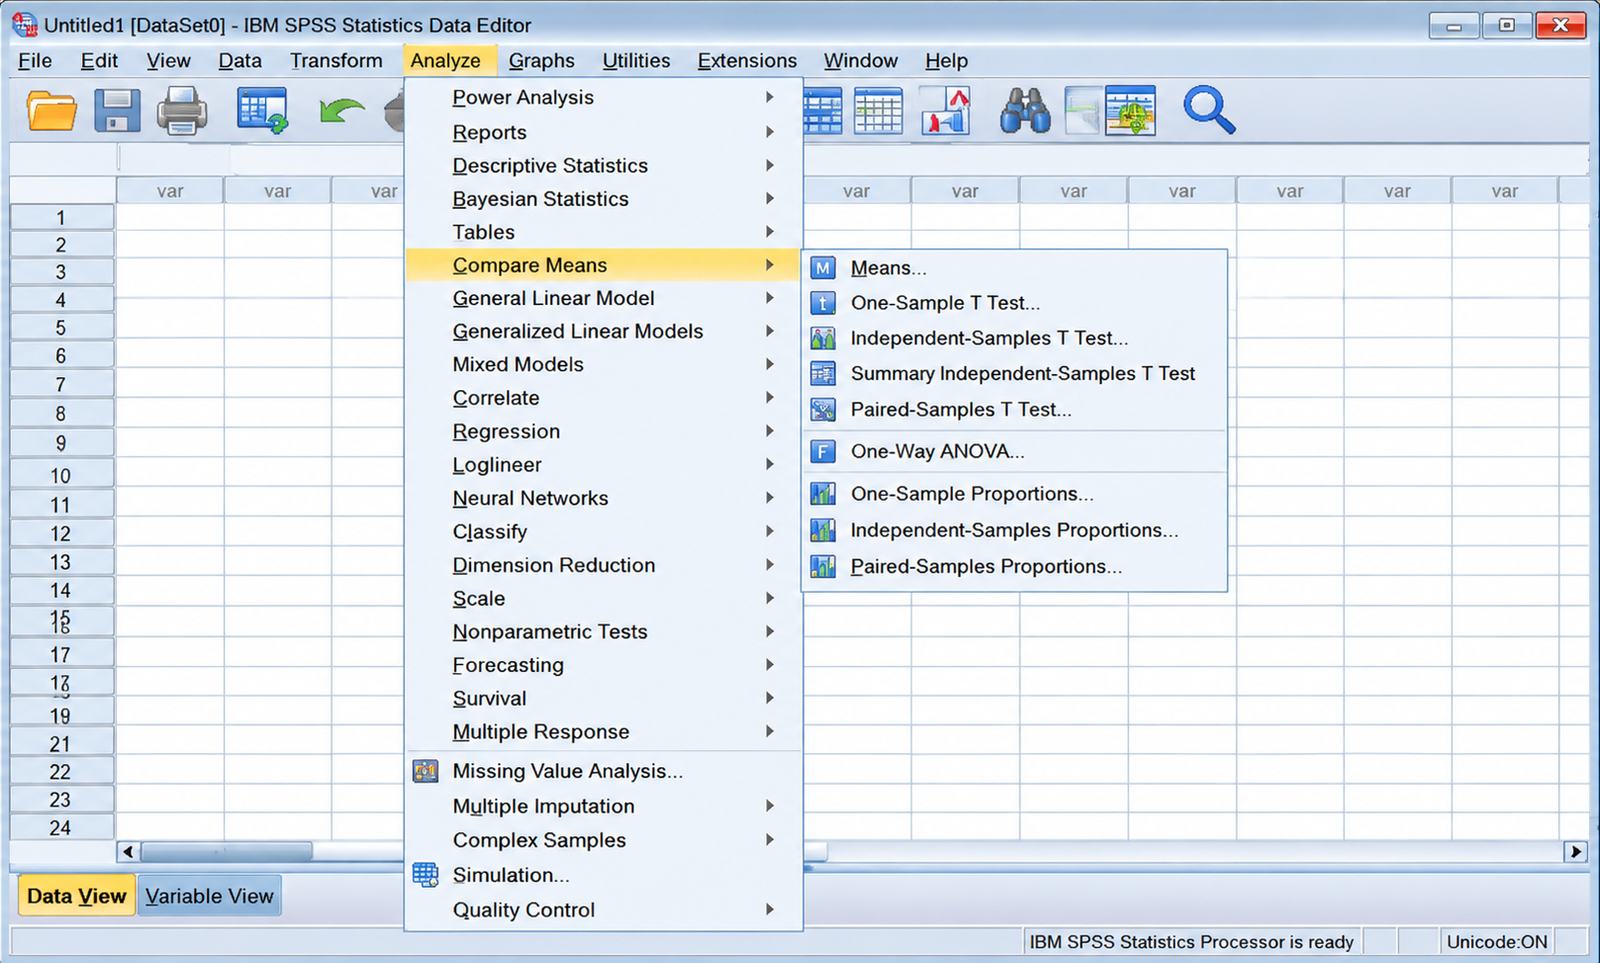
A t-test is generally used when researchers want to compare the means of two groups. For example, a researcher may compare the average examination scores of students who received two different teaching methods.
There are different types of t-tests. An independent-samples t-test compares two separate groups, while a paired-samples t-test compares measurements from the same participants, such as scores collected before and after an intervention.
Understanding ANOVA
ANOVA is used when researchers need to compare the means of three or more groups. For example, a researcher may want to determine whether customer satisfaction differs among customers using three different service providers.
ANOVA examines whether the variation between groups is sufficiently large compared with the variation within groups. A statistically significant ANOVA result indicates that at least one group mean differs, but it does not identify exactly which groups are different.
Which Test Should You Use?
A simple rule can help:
- Two independent groups: Independent-samples t-test
- Two related measurements: Paired-samples t-test
- Three or more independent groups: One-way ANOVA
- Three or more related measurements: Repeated-measures ANOVA
Researchers should also check assumptions such as independence, approximate normality and homogeneity of variance before interpreting results.
The Key Difference
The main difference is the number and structure of groups being compared. A t-test is appropriate for two-group comparisons, whereas ANOVA is designed to compare three or more group means efficiently.
Selecting the correct test should always be based on the research question, study design and characteristics of the data, rather than simply choosing the most familiar statistical method.
A Beginner’s Guide to Reading SPSS Output Tables — addresses the exact confusion your SPSS page already names as a pain point
Description: Learn how to read and understand the most common SPSS output tables without feeling overwhelmed by rows of numbers. This beginner-friendly guide explains what to look for and how to interpret the results correctly.
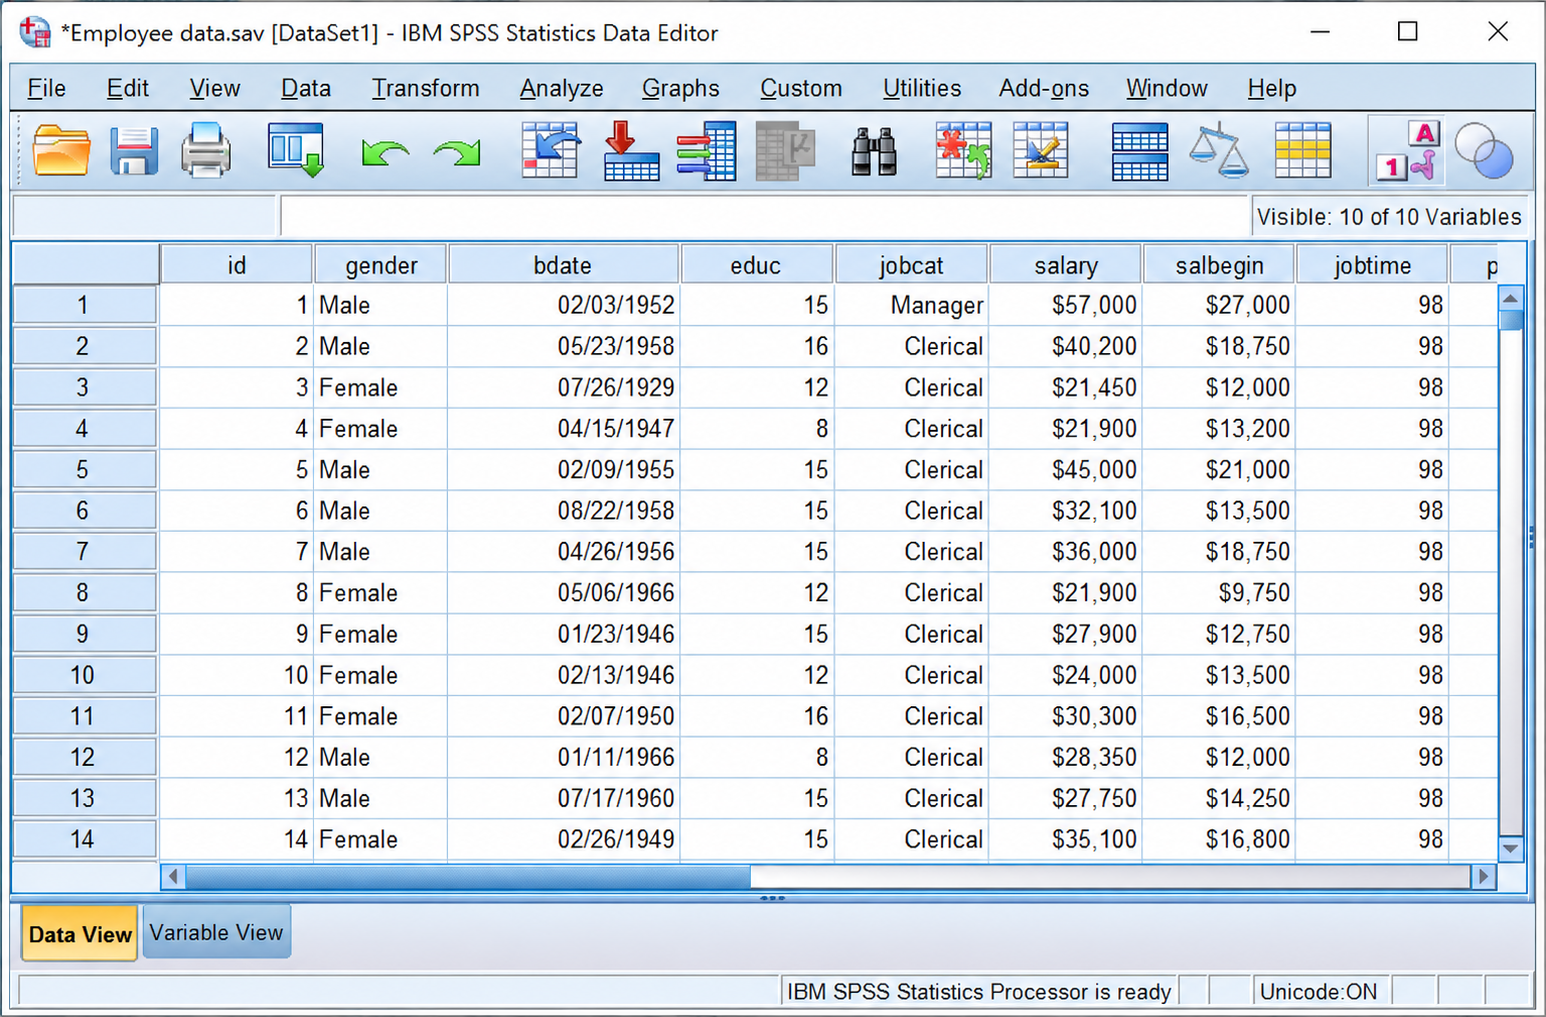
For beginners, opening an SPSS output file can feel confusing. Tables contain statistics, significance values, degrees of freedom and coefficients, often presented all at once. However, researchers do not need to understand every number immediately. The key is knowing which table answers the research question and which values matter most.
Understanding the SPSS Output
SPSS automatically produces output tables after a statistical test is performed. The tables are designed to provide the numerical evidence needed to evaluate research hypotheses. Instead of reading every value, begin by identifying the statistical test you performed.
For example, a correlation analysis produces a Correlations table, while a regression analysis produces tables such as Model Summary, ANOVA and Coefficients.
Focus on the Significance Value
One of the most important values for beginners is the Sig. value, commonly reported as the p-value. A commonly used significance level is 0.05.
If the p-value is below 0.05, the result is generally considered statistically significant. If it is above 0.05, the result is generally considered not statistically significant.
However, statistical significance should not be interpreted alone. Researchers should also consider the effect size, direction and practical meaning of the findings.
Reading Common Tables
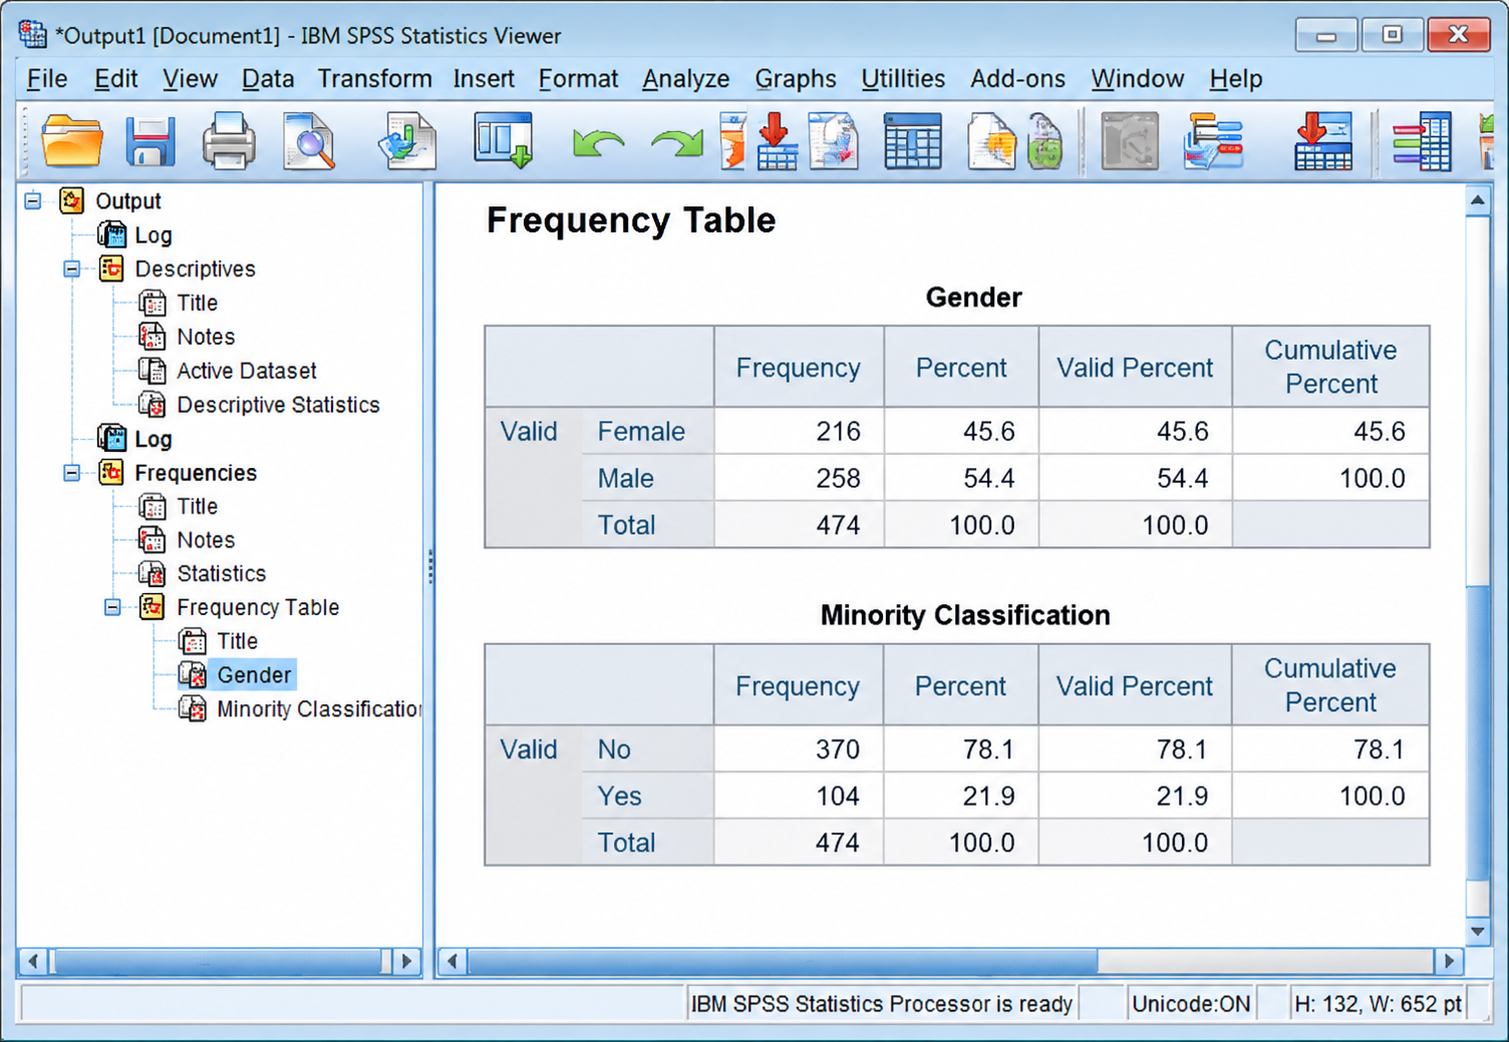
The Descriptive Statistics table provides basic information such as the mean, standard deviation and sample size.
The Correlation table shows the strength and direction of relationships between variables through the correlation coefficient.
For regression analysis, the Model Summary provides R and R², while the ANOVA table evaluates the overall significance of the regression model. The Coefficients table helps determine the contribution and statistical significance of individual predictors.
Once these questions become familiar, SPSS output becomes much easier to understand. The objective is not to memorise every statistic, but to connect the important numbers with the research question and explain what the results actually mean.
How to Check Assumptions Before Running ANOVA in SPSS
Description: Learn how to check the key assumptions of ANOVA in SPSS before interpreting your results. This beginner-friendly guide explains normality, independence, homogeneity of variance and what to do when assumptions are not satisfied.
ANOVA is a widely used statistical technique for comparing the means of three or more groups. However, researchers should not immediately interpret an ANOVA table after running the test. Before drawing conclusions, it is important to check whether the data meet the assumptions required for ANOVA.
Understanding ANOVA Assumptions
ANOVA relies on several important assumptions. The first is independence of observations, meaning that the observations in one group should not influence observations in another group. This assumption mainly depends on how the research was designed and how participants were selected.
The second assumption concerns normality. The dependent variable should be approximately normally distributed within each group. This can be examined using graphical methods such as histograms and Q-Q plots, as well as appropriate normality tests.
Checking Homogeneity of Variance
Another important assumption is homogeneity of variances. This means that the variability of the dependent variable should be reasonably similar across the groups.
In SPSS, researchers commonly use Levene’s Test to assess this assumption. A significance value greater than 0.05 is generally interpreted as indicating that the assumption of equal variances has not been violated.
Checking the Data in SPSS
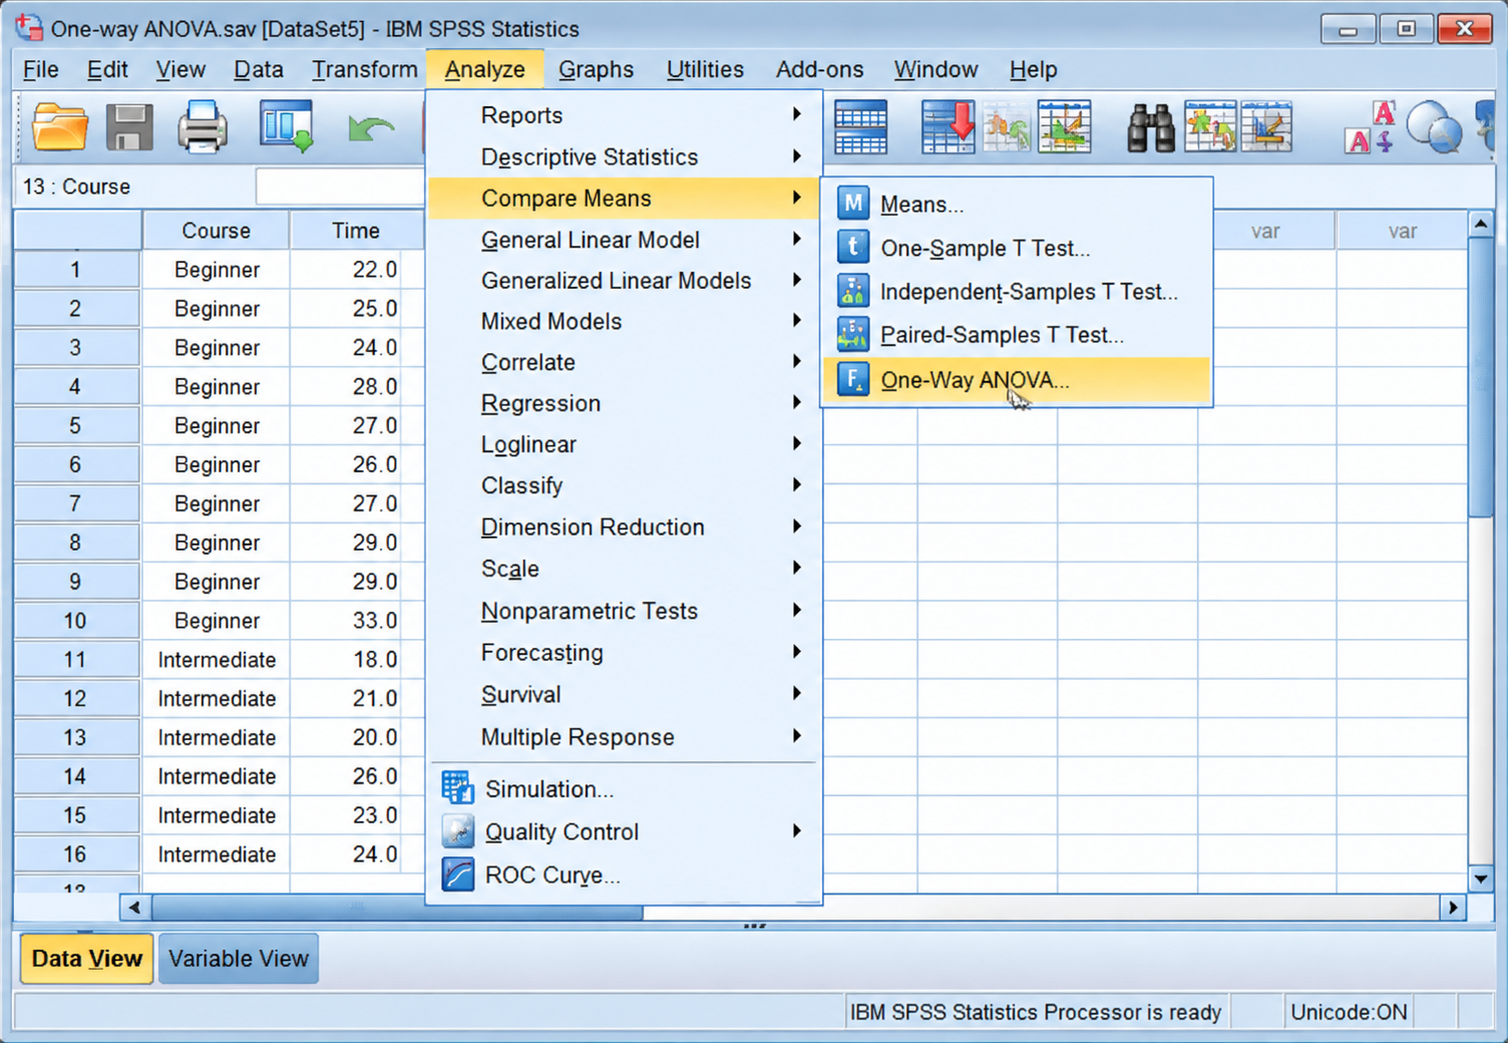
Before running the main ANOVA, examine your data using Analyze → Descriptive Statistics → Explore. Place the dependent variable in the appropriate box and use the grouping variable to examine distributions across groups.
You can request descriptive statistics and graphical outputs to identify unusual observations, skewness and potential outliers.
What If an Assumption Is Violated?
An assumption violation does not always mean that the research must stop. The appropriate response depends on the severity of the violation, sample size and research design. Researchers may consider transformations, robust alternatives or non-parametric methods when appropriate.
Final Thought
Checking assumptions is an essential part of responsible statistical analysis. Rather than treating SPSS output as a collection of numbers, researchers should first establish whether their data are suitable for ANOVA. A careful assumption-checking process makes the final statistical interpretation more reliable and defensible.
Understanding Cronbach’s Alpha: What It Means and How to Report It” — ties to your own case study result (0.991)
Description: Learn what Cronbach’s Alpha means, how to interpret reliability results in SPSS, and how to report the statistics clearly in academic research. A practical guide for researchers working with questionnaire and survey data.
When researchers use questionnaires to measure concepts such as satisfaction, motivation or customer loyalty, they need to establish whether the items consistently measure the same underlying construct. Cronbach’s Alpha is one of the most commonly used measures of internal consistency reliability. Although the SPSS output may look technical, the basic interpretation is straightforward.
Understanding Cronbach’s Alpha
Cronbach’s Alpha, represented by α, measures the internal consistency of a set of questionnaire items. In simple terms, it indicates how closely related the items are when they are intended to measure the same construct.
The value generally ranges from 0 to 1, with higher values indicating greater internal consistency. Researchers commonly use values around 0.70 or above as an indication of acceptable reliability, although the appropriate threshold can depend on the research context and stage of scale development.
Finding Alpha in SPSS
To calculate Cronbach’s Alpha in SPSS, select Analyze → Scale → Reliability Analysis. Move the relevant questionnaire items into the analysis box and select Alpha as the reliability model.
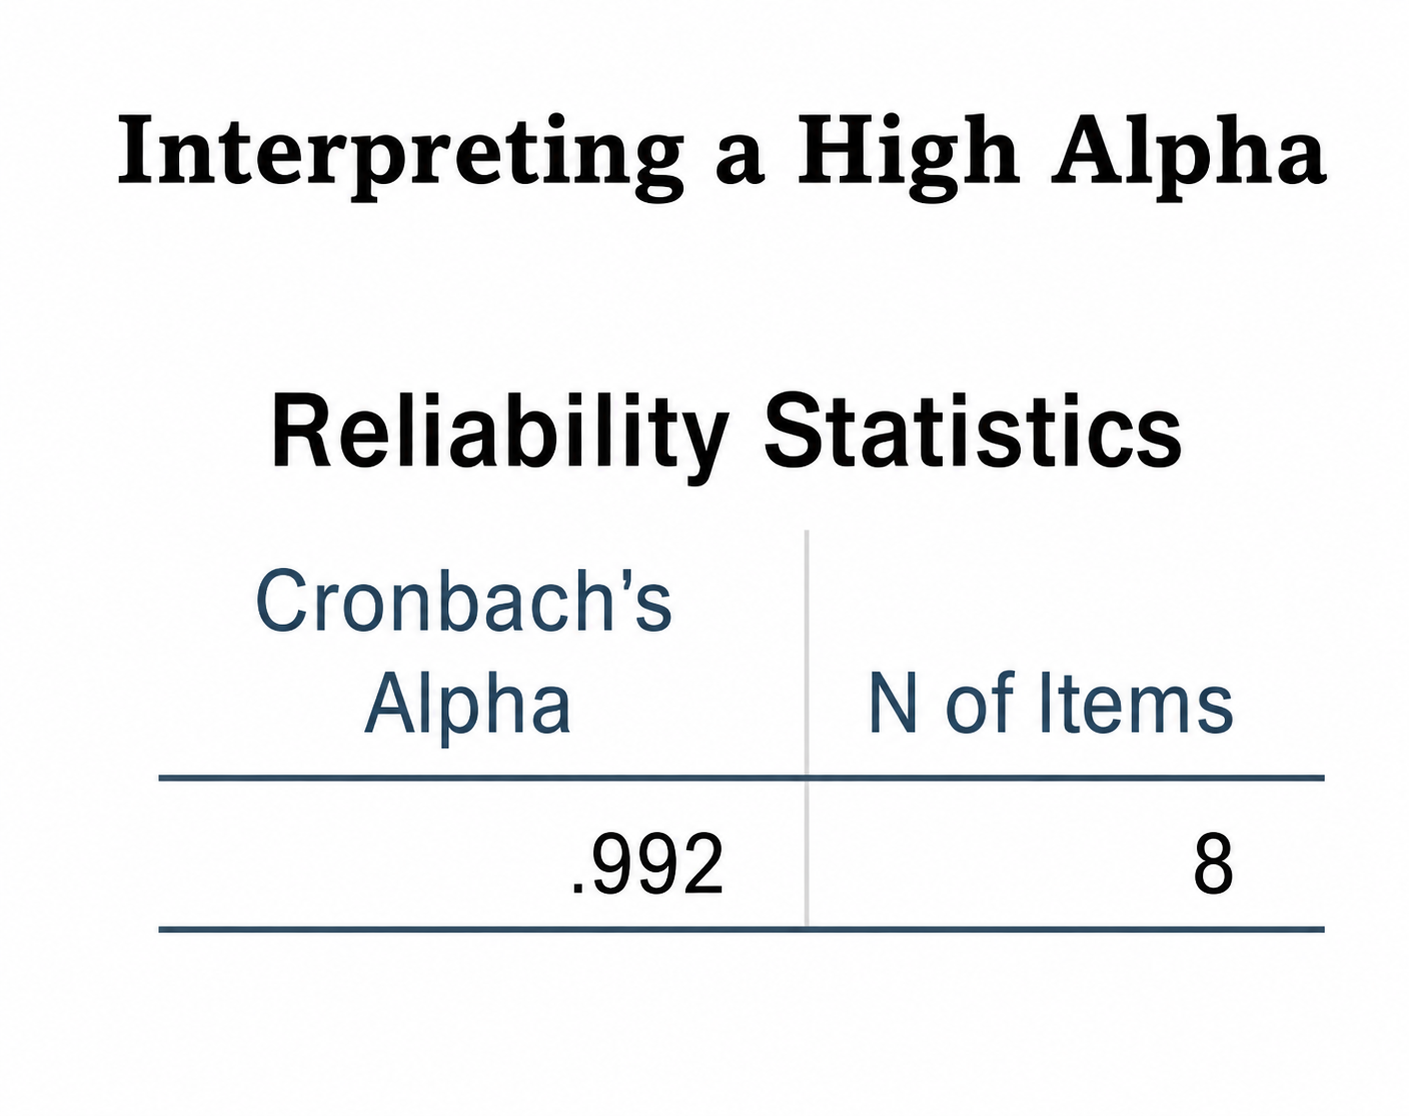
SPSS then produces a Reliability Statistics table containing the Cronbach’s Alpha value and the number of items included in the analysis.
A very high Alpha indicates strong internal consistency, but higher is not automatically better. For example, a Cronbach’s Alpha of 0.991, as observed in the case study, indicates extremely high internal consistency among the items included in that scale.
However, researchers should also examine whether the items are unnecessarily repetitive. An extremely high value may sometimes suggest that several questions are measuring almost exactly the same aspect of a construct.
Final Thought
Cronbach’s Alpha is an important first step in evaluating questionnaire reliability. However, it should be interpreted alongside the research context, item design and other evidence of measurement quality. A strong reliability coefficient supports confidence that the items are measuring a consistent construct, but it does not by itself prove that the scale is valid.
Mann-Whitney U Test vs. Independent Samples T-Test: A Comparison
Choosing between the Mann-Whitney U test and the independent samples t-test is a common point of confusion in SPSS dissertations. Both compare two independent groups, but they answer the question in slightly different ways. In my experience, students often choose the test because it appears frequently in previous dissertations rather than because it fits their own data, which is a risky shortcut.
When Should You Use an Independent Samples T-Test?
The independent samples t-test is designed to compare the means of a continuous outcome between two independent groups. For example, you might compare mean job satisfaction scores between male and female employees.
Before using it, you should definitely check the assumptions. The observations should be independent, the outcome should be approximately normally distributed within each group, and the variances should be considered. SPSS provides Levene’s test for equality of variances. If Levene’s test is significant (p < .05), use the “Equal variances not assumed” row when reporting the t-test result.
When Is the Mann-Whitney U Test Better?
The Mann-Whitney U test is a non-parametric alternative when the assumptions for the t-test are not satisfied, particularly when the outcome is ordinal or strongly non-normal. Instead of comparing means directly, it evaluates whether scores in one group tend to be higher or lower than scores in the other group.
This distinction matters. A frequent mistake is saying that Mann-Whitney “compares medians” in every situation. It can support a median comparison when the distributions have a similar shape, but the safer interpretation is that it compares the distributions or ranks between groups.
My Practical Rule
I would not decide based on normality alone. Look at the measurement level, group independence, distribution, outliers and the research question together. If a continuous outcome is suitable for a t-test, use it rather than automatically switching to a non-parametric test. If the data are ordinal or heavily skewed, Mann-Whitney may be more defensible.
The key lesson is simple: do not choose the test because SPSS makes it easy. Choose it because your data and research questions justify it. A well-explained statistical decision is more valuable than simply reporting a significant p-value.
How to Write Up SPSS Results for Your Dissertation (APA Style)
Running an analysis in SPSS is only half the job. The difficult part is turning output into a clear argument. I often see results filled with copied tables and screenshots, yet the reader cannot tell what the analysis found. Good APA-style reporting should explain the result, support it with key statistics and connect it to the research question.
Start With the Test and Its Purpose
Begin by starting what analysis was conducted and why. For example: “An independent sample t-test was conducted to examine whether job satisfaction differed between two employee groups.” This tells the reader what was tested and why.
Report the Important Statistics
Do not paste the entire SPSS output into the main text. Select the statistics that matter the most. Depending on the test, this may include descriptive statistics, the test statistic, degrees of freedom, p-value, confidence interval and effect size.
For a t-test, an APA-style sentence might look like: “Job satisfaction was significantly higher in Group A (M = 4.21, SD = 0.56) than Group B (M = 3.74, SD = 0.61), t(98) = 3.91, p < .001, d = 0.79.”
Notice that this report is more than significant. Effect size helps the reader judge the practical magnitude of the difference. This is an important lesson because a statistically significant finding is not automatically an important finding.
Do Not Interpret SPSS Mechanically
One of the biggest improvements you can make is to stop treating the “Sig” column as the conclusion. Check assumptions where appropriate, identify the correct SPSS row, and interpret the direction and size of the findings.
For example, with Levene’s test, p < .05 means the equal-variance assumption is not supported, so the “Equal variances not assumed” result should normally be used.
My Reporting Checklist
Before submitting, I ask:
- Have I explained why the test was used?
- Have I reported the relevant statistics?
- Have I included effect size where appropriate?
- Have I avoided claiming causation from an association?
- Does the paragraph answer the research question?
APA style is not about making statistics look complicated. It is about making your evidence precise, readable and defensible.









Comments are closed